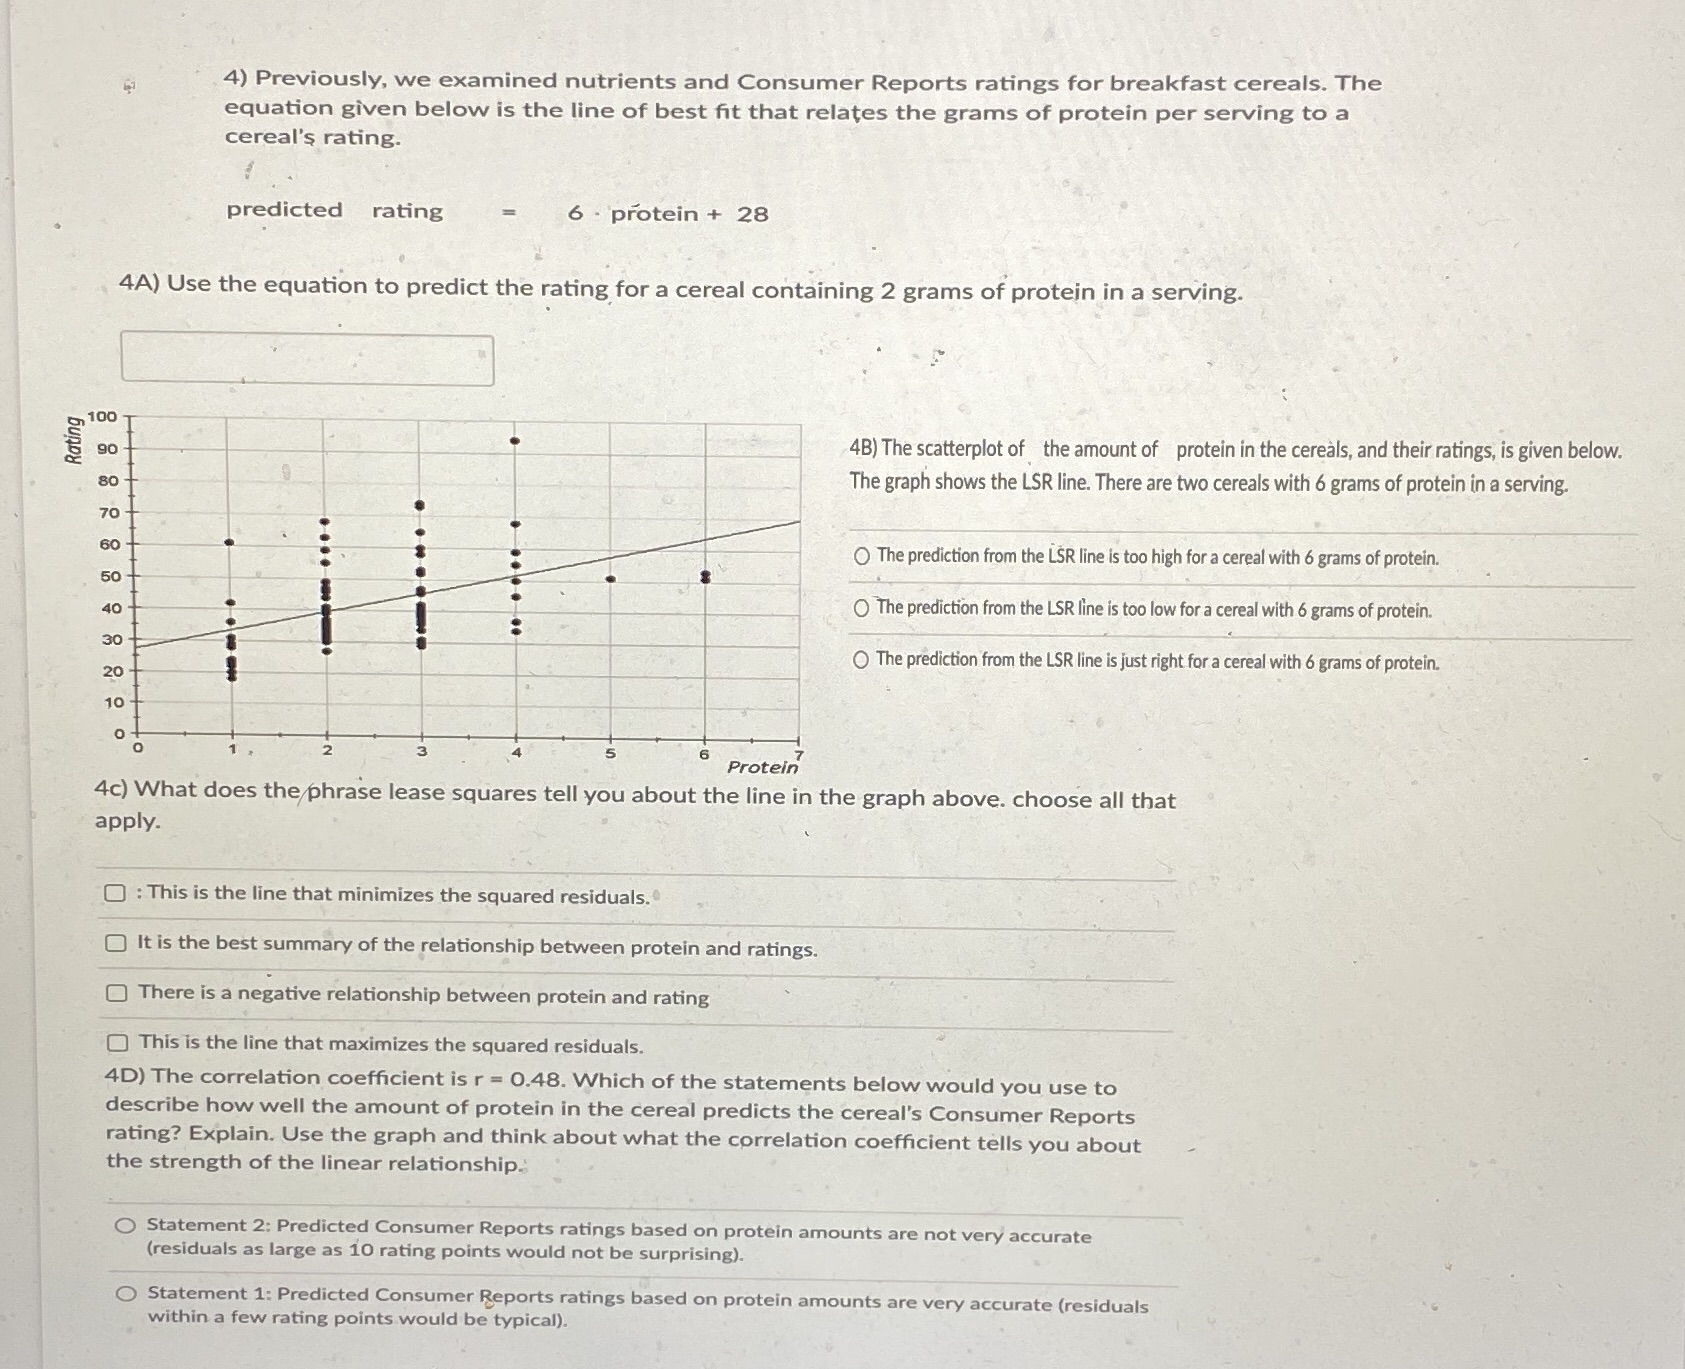
4) Previously, we examined nutrients and Consumer Reports ratings for breakfast cereals. The equation given below is the line of best fit that relates the grams of protein per serving to a cereal's rating. predicted rating 6 - protein + 28 4A) Use the equation to predict the rating for a cereal containing 2 grams of protein in a serving. 100 Rating 4B) The scatterplot of the amount of protein in the cereals, and their ratings, is given below. The graph shows the LSR line. There are two cereals with 6 grams of protein in a serving. ... The prediction from the LSR line is too high for a cereal with 6 grams of protein. 0 8 8 6 8 8 8 8 8 The prediction from the LSR line is too low for a cereal with 6 grams of protein. .. The prediction from the LSR line is just right for a cereal with 6 grams of protein. 6 Protein 4c) What does the phrase lease squares tell you about the line in the graph above. choose all that apply. O : This is the line that minimizes the squared residuals. O) It is the best summary of the relationship between protein and ratings. There is a negative relationship between protein and rating This is the line that maximizes the squared residuals. 4D) The correlation coefficient is r = 0.48. Which of the statements below would you use to describe how well the amount of protein in the cereal predicts the cereal's Consumer Reports rating? Explain. Use the graph and think about what the correlation coefficient tells you about the strength of the linear relationship. Statement 2: Predicted Consumer Reports ratings based on protein amounts are not very accurate (residuals as large as 10 rating points would not be surprising). Statement 1: Predicted Consumer Reports ratings based on protein amounts are very accurate (residuals within a few rating points would be typical)