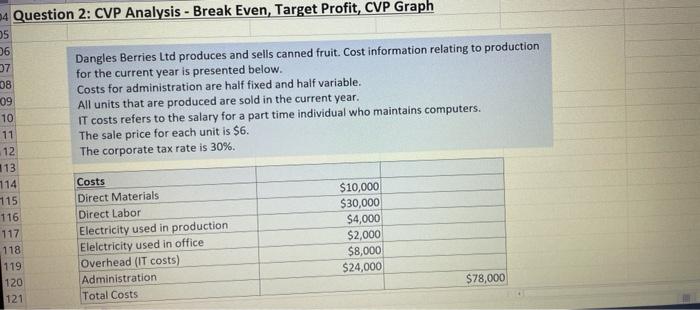
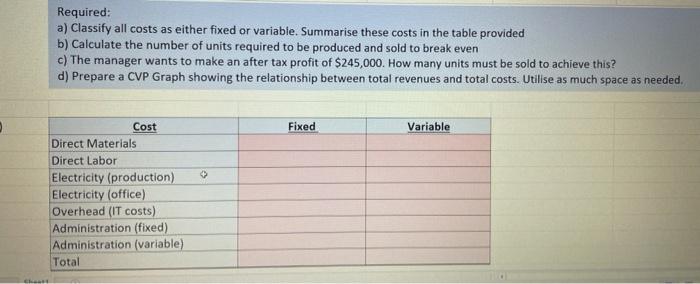
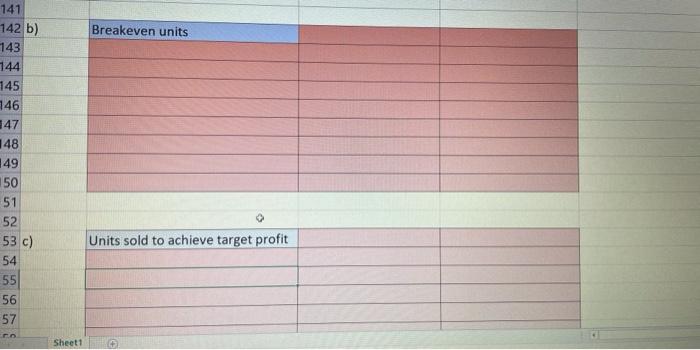
4 Question 2: CVP Analysis - Break Even, Target Profit, CVP Graph Dangles Berries Ltd produces and sells canned fruit. Cost information relating to production for the current year is presented below. Costs for administration are half fixed and half variable. All units that are produced are sold in the current year. IT costs refers to the salary for a part time individual who maintains computers. The sale price for each unit is $6. The corporate tax rate is 30%. 05 06 37 08 09 10 11 12 113 114 115 116 117 118 119 120 121 Costs Direct Materials Direct Labor Electricity used in production Electricity used in office Overhead (IT costs) Administration Total Costs $10,000 $30,000 $4,000 $2,000 $8,000 $24,000 $78,000 Required: a) Classify all costs as either fixed or variable. Summarise these costs in the table provided b) Calculate the number of units required to be produced and sold to break even c) The manager wants to make an after tax profit of $245,000. How many units must be sold to achieve this? d) Prepare a CVP Graph showing the relationship between total revenues and total costs. Utilise as much space as needed. Fixed Variable Cost Direct Materials Direct Labor Electricity (production) Electricity (office) Overhead (IT costs) Administration (fixed) Administration (variable) Total El Breakeven units 141 142 b) 143 144 145 146 147 148 49 150 51 52 53 c) 54 55 56 57 Units sold to achieve target profit Sheet1 4 Question 2: CVP Analysis - Break Even, Target Profit, CVP Graph Dangles Berries Ltd produces and sells canned fruit. Cost information relating to production for the current year is presented below. Costs for administration are half fixed and half variable. All units that are produced are sold in the current year. IT costs refers to the salary for a part time individual who maintains computers. The sale price for each unit is $6. The corporate tax rate is 30%. 05 06 37 08 09 10 11 12 113 114 115 116 117 118 119 120 121 Costs Direct Materials Direct Labor Electricity used in production Electricity used in office Overhead (IT costs) Administration Total Costs $10,000 $30,000 $4,000 $2,000 $8,000 $24,000 $78,000 Required: a) Classify all costs as either fixed or variable. Summarise these costs in the table provided b) Calculate the number of units required to be produced and sold to break even c) The manager wants to make an after tax profit of $245,000. How many units must be sold to achieve this? d) Prepare a CVP Graph showing the relationship between total revenues and total costs. Utilise as much space as needed. Fixed Variable Cost Direct Materials Direct Labor Electricity (production) Electricity (office) Overhead (IT costs) Administration (fixed) Administration (variable) Total El Breakeven units 141 142 b) 143 144 145 146 147 148 49 150 51 52 53 c) 54 55 56 57 Units sold to achieve target profit Sheet1