Answered step by step
Verified Expert Solution
Link Copied!

Question

1 Approved Answer

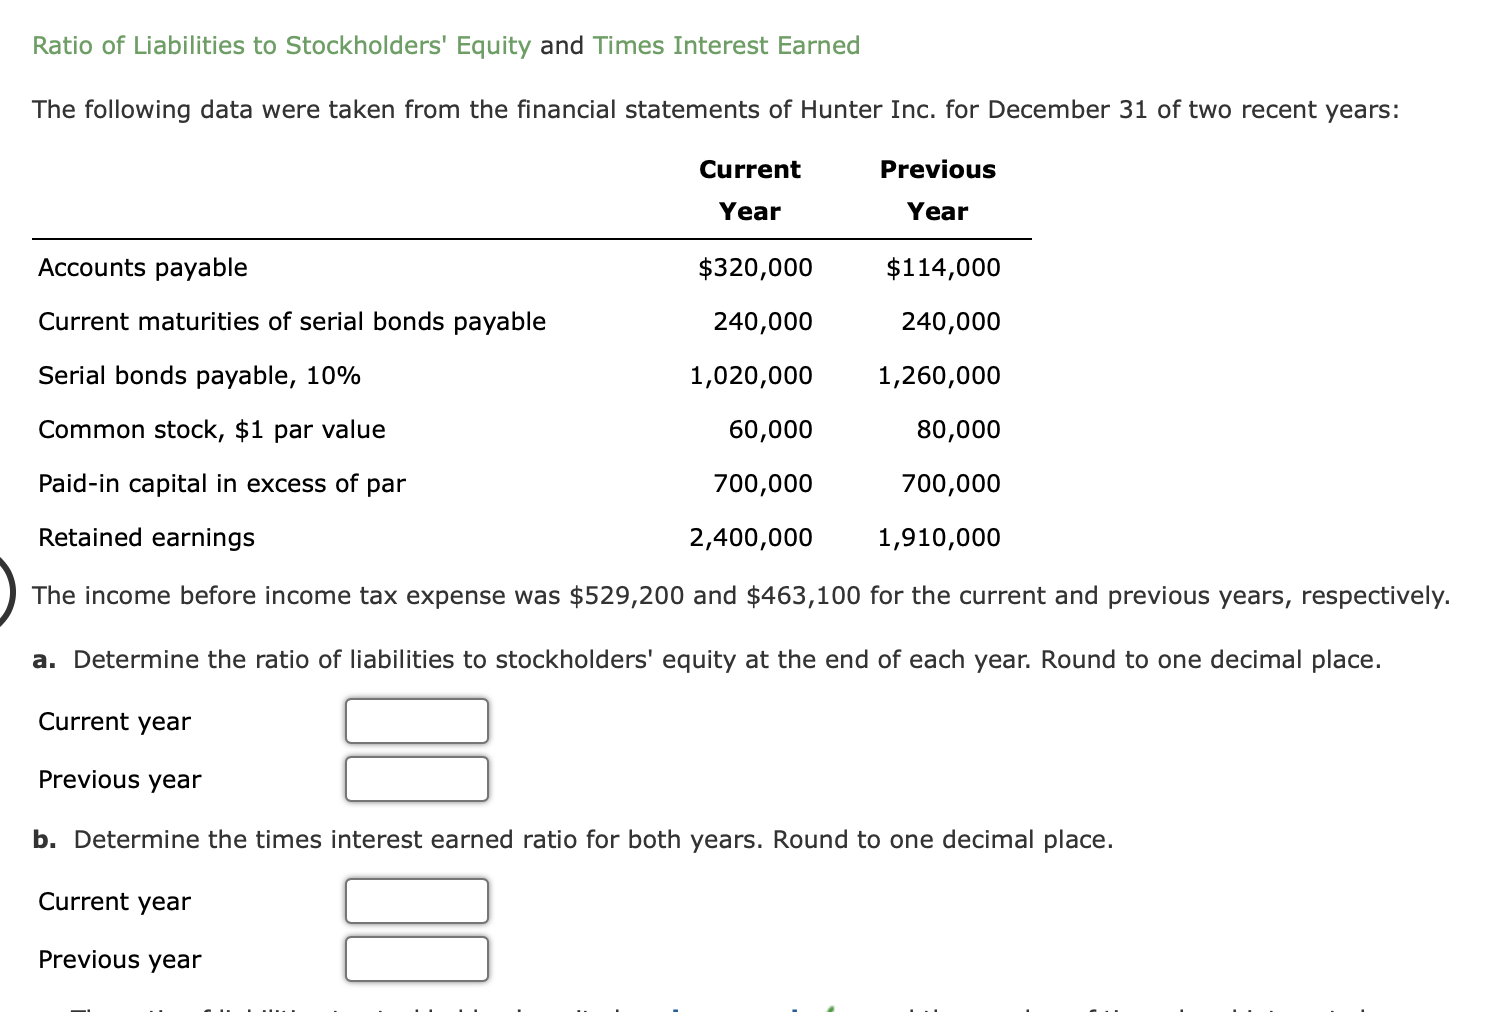
4 Questions: Question 1) Please refer to the picture below: Determine the ratio of liabilities to Stockholders equity at the end of the year (Current

4 Questions:

Question 1) Please refer to the picture below:

  • Determine the ratio of liabilities to Stockholders equity at the end of the year (Current year and previous year). Round to one decimal place.
  • Determine the times interest earned ratio for both years. Round to one decimal place.

image text in transcribed

Question 2) Three major segments of the transportation industry are motor carriers, such as Atlantic; railroads, such as Pacific; and transportation arrangement services, such as Mediterranean. Recent financial statement information for these three companies is shown as follows (in thousands of dollars):

Atlantic Pacific Mediterranean
Sales $347,844 $2,749,186 $2,057,436
Average total assets 869,610 1,446,940 571,510

Determine the asset turnover for all three companies. Round to one decimal place.

  • Atlantic: _______
  • Pacific: _______
  • Mediterranean: ________

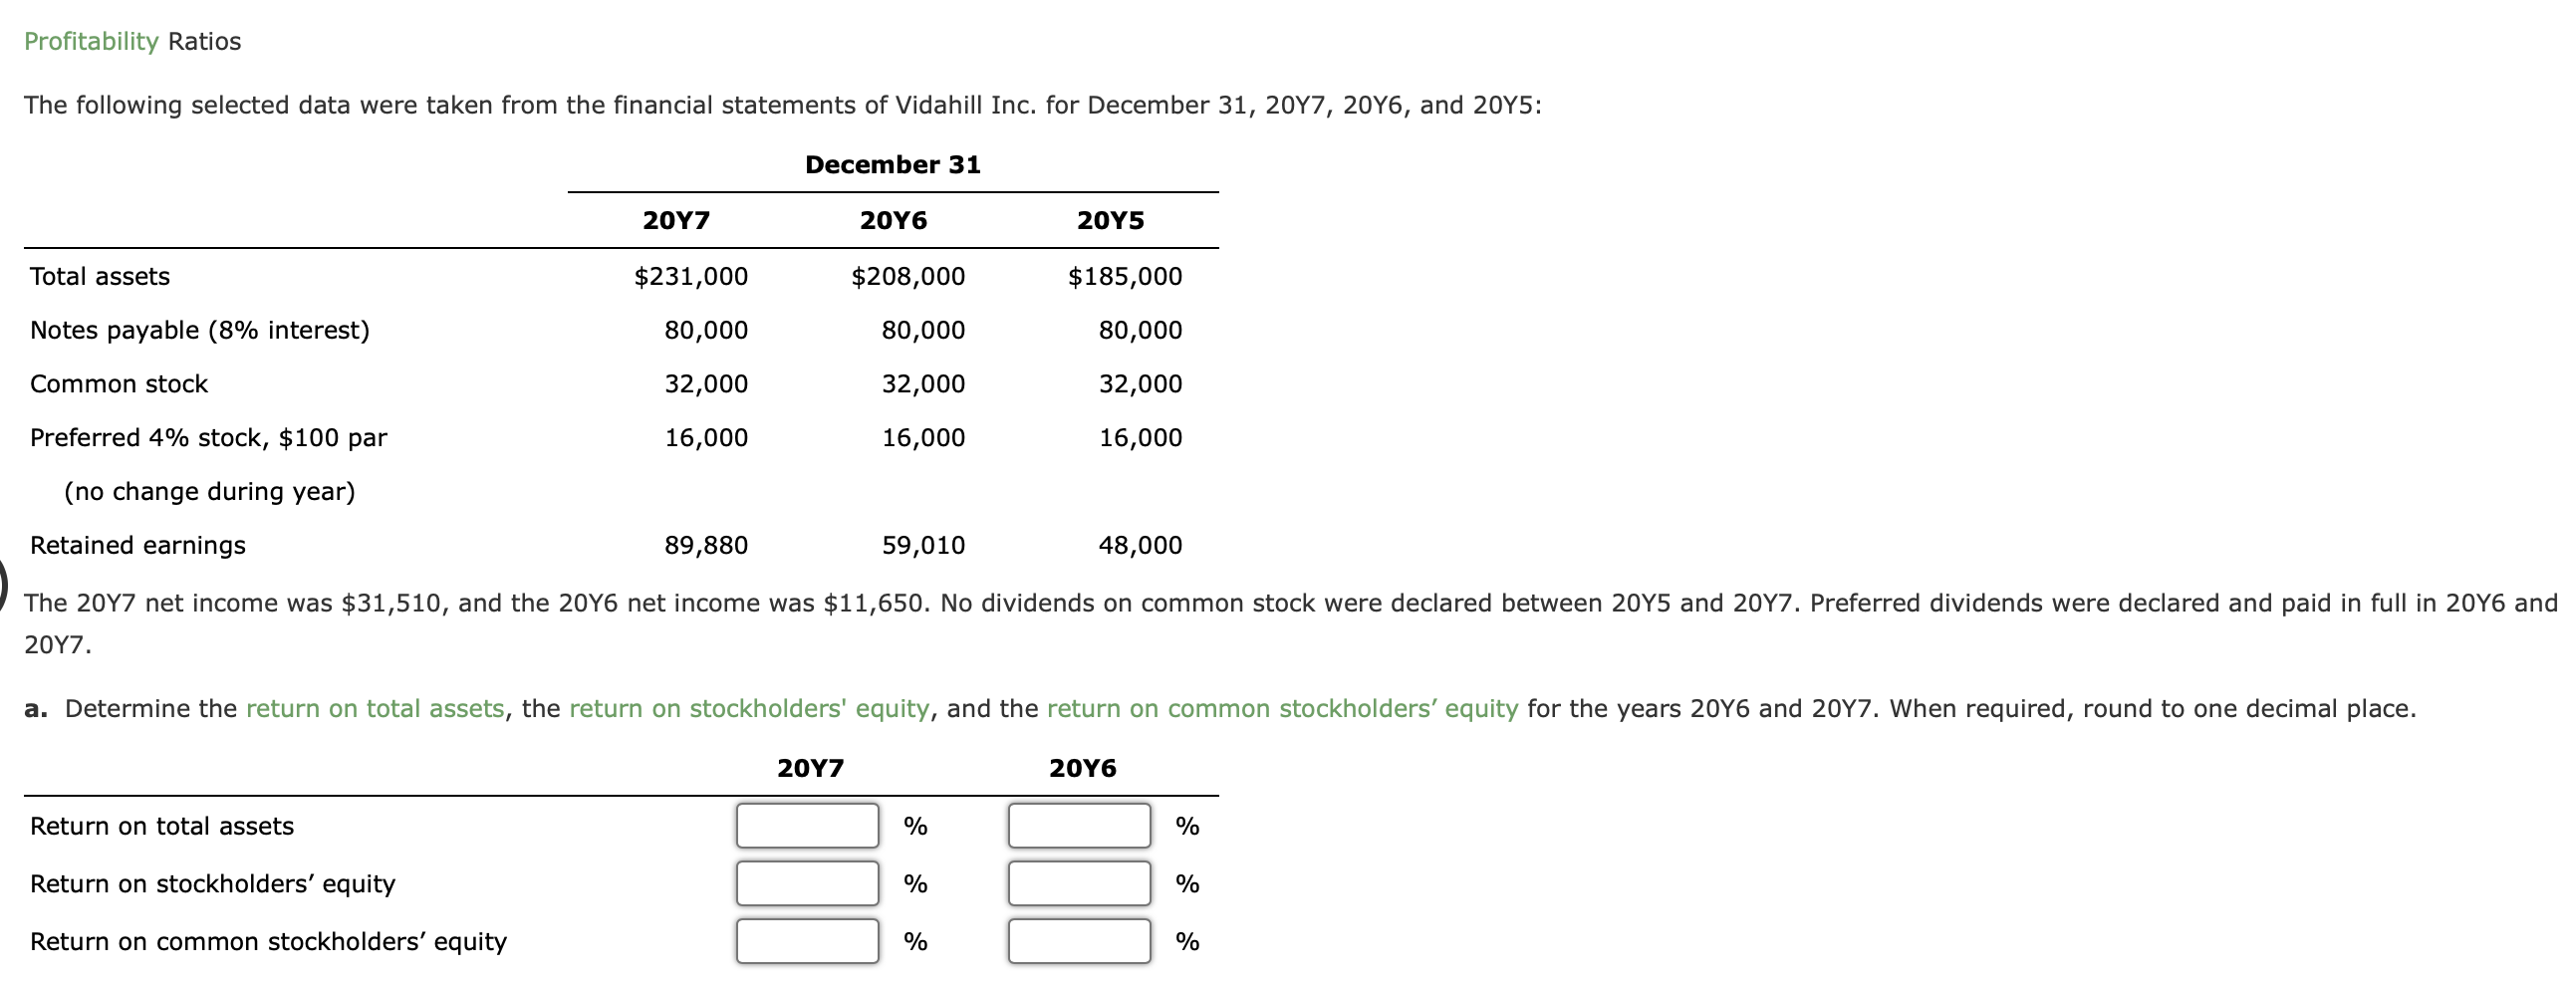
Question 3) Please refer to the picture below:

Determine the return on total assets, the return on stockholders equity, and the return on common stockholders equity for the years 20Y6 and 20Y7. When required, round to one decimal place.

image text in transcribed

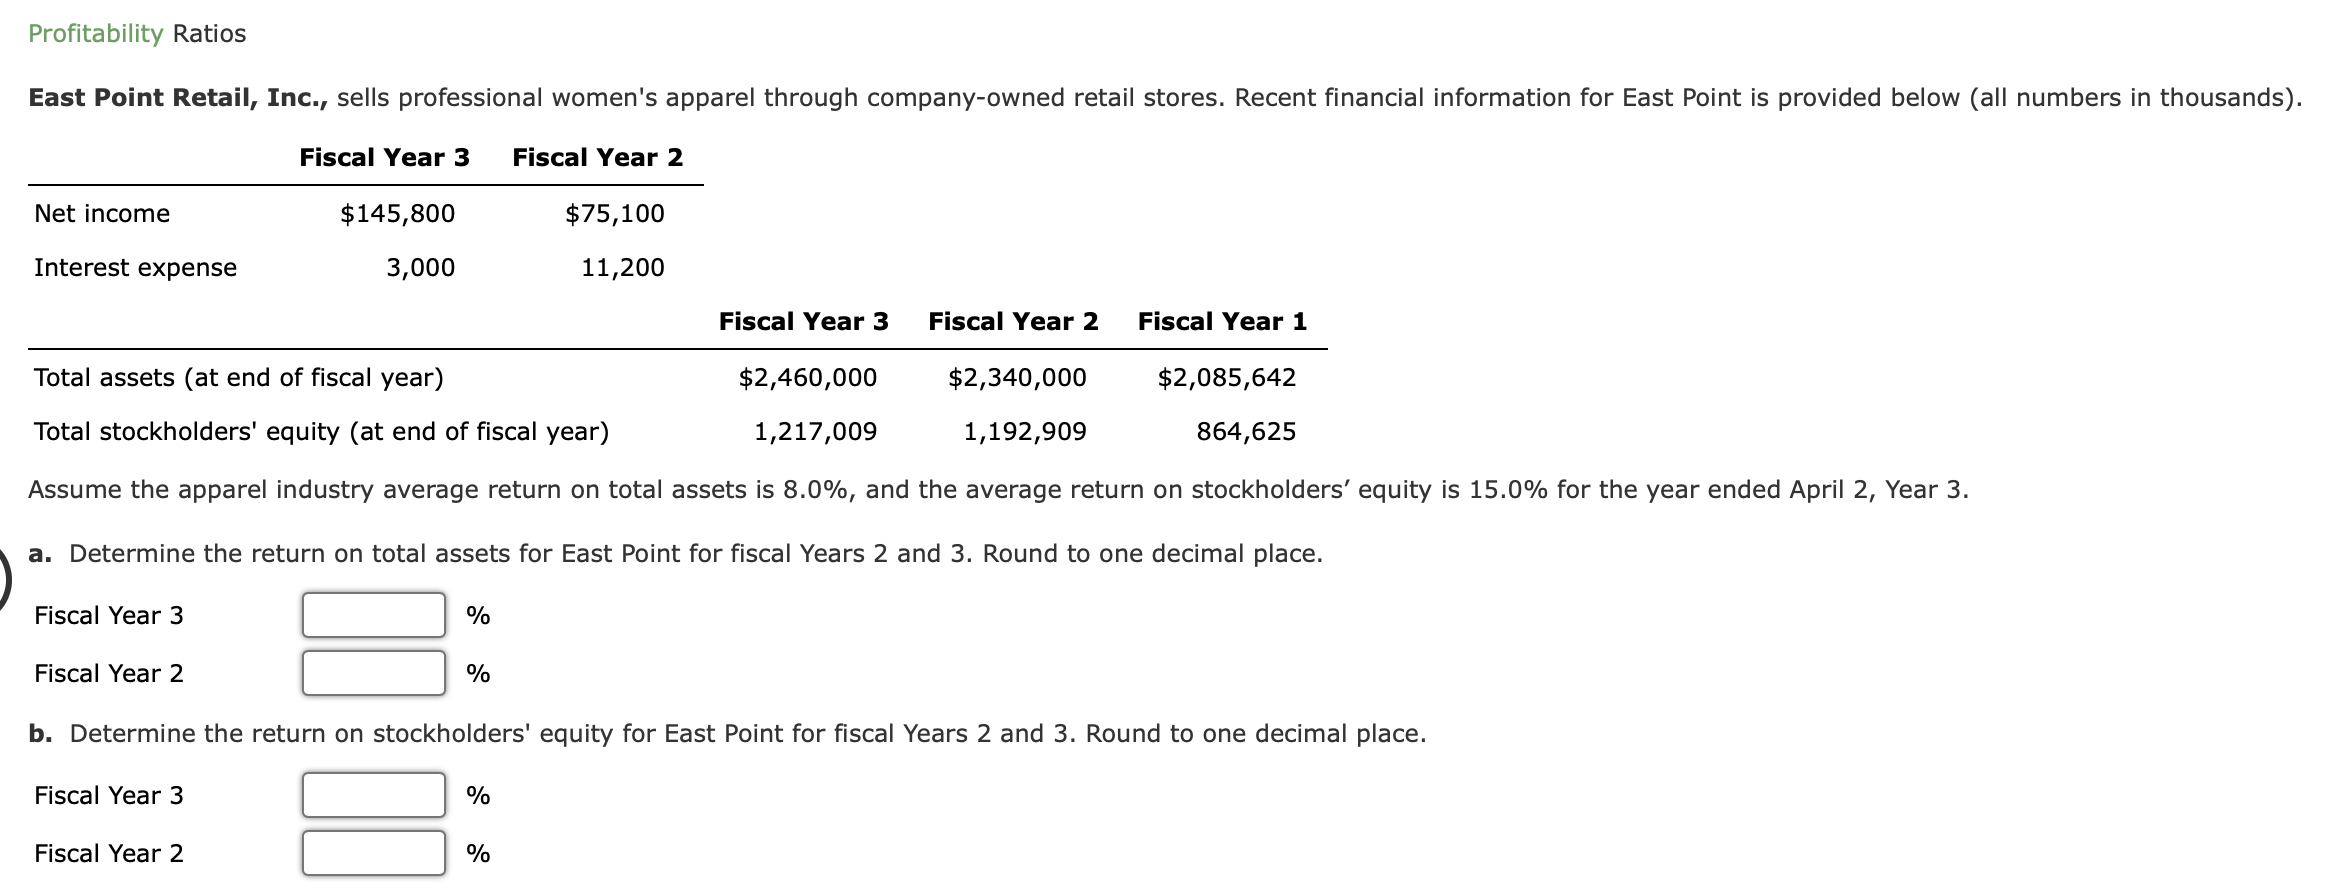
Question 4) Please refer to the picture below:

  • Determine the return on total assets for East Point for fiscal years 2 and 3. Round to one decimal place.
  • Determine the return on stockholders equity East Point for fiscal years 2 and 3. Round to one decimal place.

image text in transcribed

Ratio of Liabilities to Stockholders' Equity and Times Interest Earned The following data were taken from the financial statements of Hunter Inc. for December 31 of two recent years: Current Previous Year Year Accounts payable $320,000 $114,000 Current maturities of serial bonds payable 240,000 240,000 Serial bonds payable, 10% 1,020,000 1,260,000 Common stock, $1 par value 60,000 80,000 Paid-in capital in excess of par 700,000 700,000 Retained earnings 2,400,000 1,910,000 The income before income tax expense was $529,200 and $463,100 for the current and previous years, respectively. a. Determine the ratio of liabilities to stockholders' equity at the end of each year. Round to one decimal place. Current year Previous year b. Determine the times interest earned ratio for both years. Round to one decimal place. Current year Previous year Profitability Ratios The following selected data were taken from the financial statements of Vidahill Inc. for December 31, 20Y7, 20Y6, and 2015: December 31 20Y7 20Y6 2045 Total assets $231,000 $208,000 $185,000 Notes payable (8% interest) 80,000 80,000 80,000 Common stock 32,000 32,000 32,000 Preferred 4% stock, $100 par 16,000 16,000 16,000 (no change during year) Retained earnings 89,880 59,010 48,000 The 2017 net income was $31,510, and the 2016 net income was $11,650. No dividends on common stock were declared between 2015 and 2047. Preferred dividends were declared and paid in full in 2046 and 2017. a. Determine the return on total assets, the return on stockholders' equity, and the return on common stockholders' equity for the years 2016 and 2007. When required, round to one decimal place. 20Y7 20Y6 Return on total assets % % Return on stockholders' equity % % Return on common stockholders' equity % % Profitability Ratios East Point Retail, Inc., sells professional women's apparel through company-owned retail stores. Recent financial information for East Point is provided below (all numbers in thousands). Fiscal Year 3 Fiscal Year 2 Net income $145,800 $75,100 Interest expense 3,000 11,200 Fiscal Year 3 Fiscal Year 2 Fiscal Year 1 $2,460,000 $2,340,000 $2,085,642 Total assets (at end of fiscal year) Total stockholders' equity (at end of fiscal year) 1,217,009 1,192,909 864,625 Assume the apparel industry average return on total assets is 8.0%, and the average return on stockholders' equity is 15.0% for the year ended April 2, Year 3. a. Determine the return on total assets for East Point for fiscal Years 2 and 3. Round to one decimal place. Fiscal Year 3 % Fiscal Year 2 % b. Determine the return on stockholders' equity for East Point for fiscal Years 2 and 3. Round to one decimal place. Fiscal Year 3 % Fiscal Year 2 %

Step by Step Solution

There are 3 Steps involved in it

Step: 1

blur-text-image

Get Instant Access to Expert-Tailored Solutions

See step-by-step solutions with expert insights and AI powered tools for academic success

Step: 2

blur-text-image

Step: 3

blur-text-image

Ace Your Homework with AI

Get the answers you need in no time with our AI-driven, step-by-step assistance

Get Started

Recommended Textbook for

Financial Accounting

Authors: Robert Libby

6th Edition

0077405641, 978-0077405649

More Books

Students also viewed these Accounting questions

Question

Explain the functions of financial management.

Answered: 1 week ago

Question

HOW MANY TOTAL WORLD WAR?

Answered: 1 week ago

Question

Discuss the scope of financial management.

Answered: 1 week ago

Question

Discuss the goals of financial management.

Answered: 1 week ago