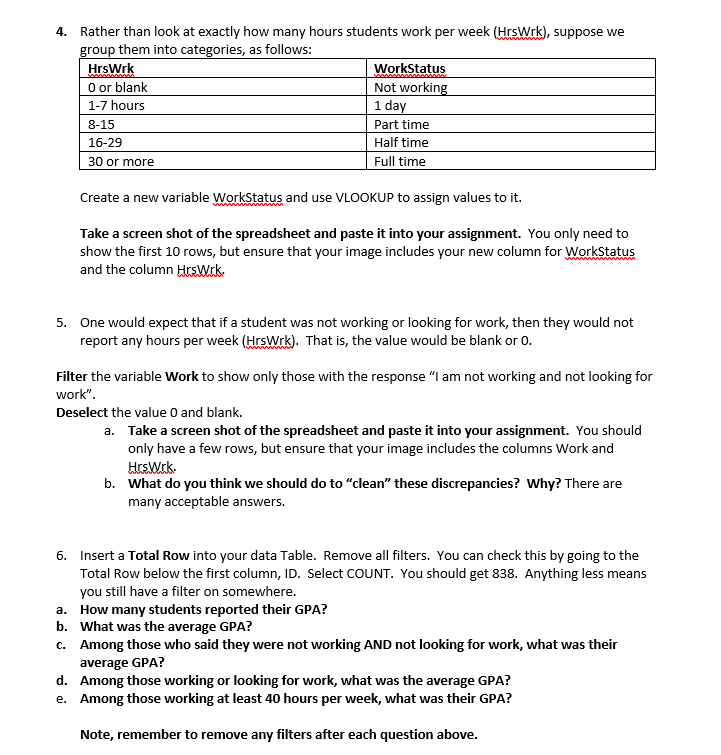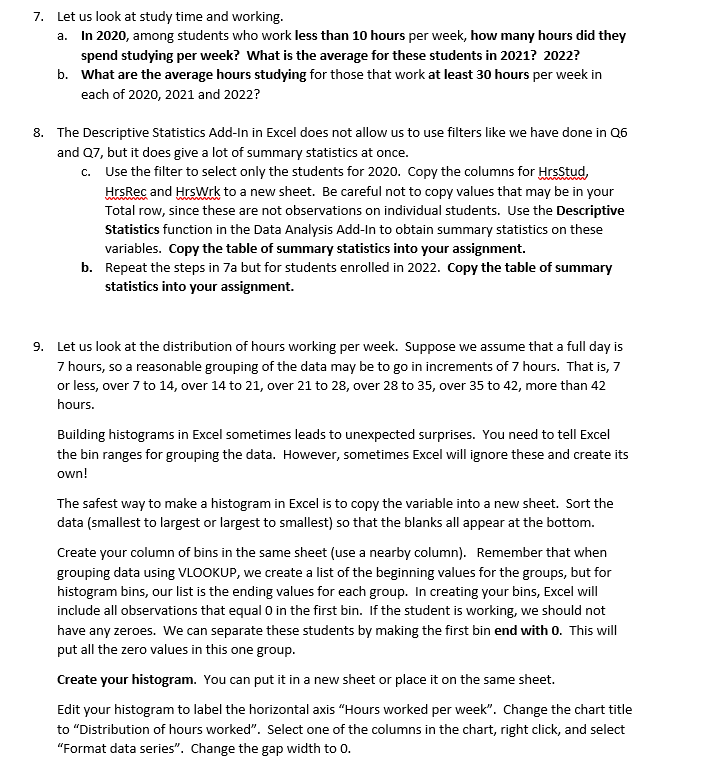


4. Rather than look at exactly how many hours students work per week (HrsWrk), suppose we group them into categories, as follows: HrsWrk WorkStatus O or blank Not working 1-7 hours 1 day 8-15 Part time 16-29 Half time 30 or more Full time Create a new variable WorkStatus and use VLOOKUP to assign values to it. Take a screen shot of the spreadsheet and paste it into your assignment. You only need to show the first 10 rows, but ensure that your image includes your new column for WorkStatus and the column HrsWik 5. One would expect that if a student was not working or looking for work, then they would not report any hours per week (HrsWrk). That is, the value would be blank or o. Filter the variable Work to show only those with the response "I am not working and not looking for work". Deselect the value 0 and blank. a. Take a screen shot of the spreadsheet and paste it into your assignment. You should only have a few rows, but ensure that your image includes the columns Work and Hrswick b. What do you think we should do to clean these discrepancies? Why? There are many acceptable answers. 6. Insert a Total Row into your data Table. Remove all filters. You can check this by going to the Total Row below the first column, ID. Select COUNT. You should get 838. Anything less means you still have a filter on somewhere. a. How many students reported their GPA? b. What was the average GPA? c. Among those who said they were not working AND not looking for work, what was their average GPA? d. Among those working or looking for work, what was the average GPA? e. Among those working at least 40 hours per week, what was their GPA? Note, remember to remove any filters after each question above. 7. Let us look at study time and working. a. In 2020, among students who work less than 10 hours per week, how many hours did they spend studying per week? What is the average for these students in 2021? 2022? b. What are the average hours studying for those that work at least 30 hours per week in each of 2020, 2021 and 2022? 8. The Descriptive Statistics Add-In in Excel does not allow us to use filters like we have done in Q6 and 07, but it does give a lot of summary statistics at once. C. Use the filter to select only the students for 2020. Copy the columns for Hrs Stud, HrsRec and HrsWrk to a new sheet. Be careful not to copy values that may be in your Total row, since these are not observations on individual students. Use the Descriptive Statistics function in the Data Analysis Add-in to obtain summary statistics on these variables. Copy the table of summary statistics into your assignment. b. Repeat the steps in 7a but for students enrolled in 2022. Copy the table of summary statistics into your assignment. 9. Let us look at the distribution of hours working per week. Suppose we assume that a full day is 7 hours, so a reasonable grouping of the data may be to go in increments of 7 hours. That is, 7 or less, over 7 to 14, over 14 to 21, over 21 to 28, over 28 to 35, over 35 to 42, more than 42 hours. Building histograms in Excel sometimes leads to unexpected surprises. You need to tell Excel the bin ranges for grouping the data. However, sometimes Excel will ignore these and create its own! The safest way to make a histogram in Excel is to copy the variable into a new sheet. Sort the data (smallest to largest or largest to smallest) so that the blanks all appear at the bottom. Create your column of bins in the same sheet (use a nearby column). Remember that when grouping data using VLOOKUP, we create a list of the beginning values for the groups, but for histogram bins, our list is the ending values for each group. In creating your bins, Excel will include all observations that equal o in the first bin. If the student is working, we should not have any zeroes. We can separate these students by making the first bin end with 0. This will put all the zero values in this one group. Create your histogram. You can put it in a new sheet or place it on the same sheet. Edit your histogram to label the horizontal axis "Hours worked per week. Change the chart title to "Distribution of hours worked". Select one of the columns in the chart, right click, and select "Format data series. Change the gap width to 0. a. Take a picture of your frequency table and histogram and paste it into your assignment. b. Excluding the first column that really represents students who are not working, then among working students, what can you say about the shape of the distribution? c. Given what you see in your histogram, do you think it was appropriate in question 5 to simply compare the GPAs of students who are working to those who were not as a way of looking at the impact of working on GPA


