

Answered step by step
Verified Expert Solution
Question
1 Approved Answer
4 Selected comparative financial statements of Korbin Company follow: Comparative Income Statements For Years Ended December 31, 2017, 2016, and 2015 Part 1 of 2
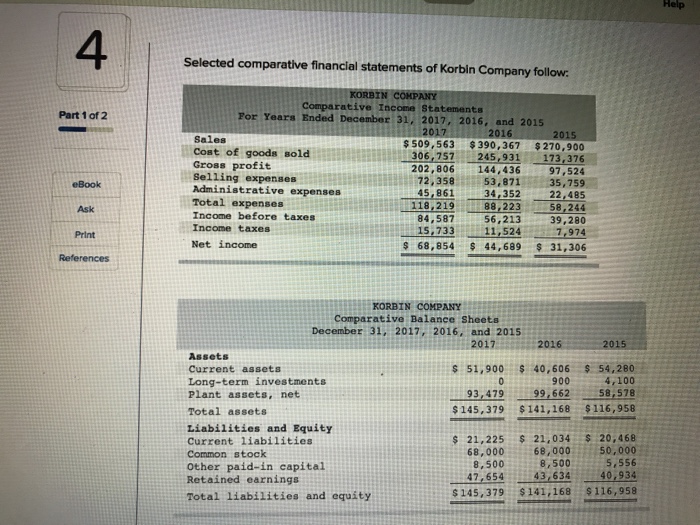
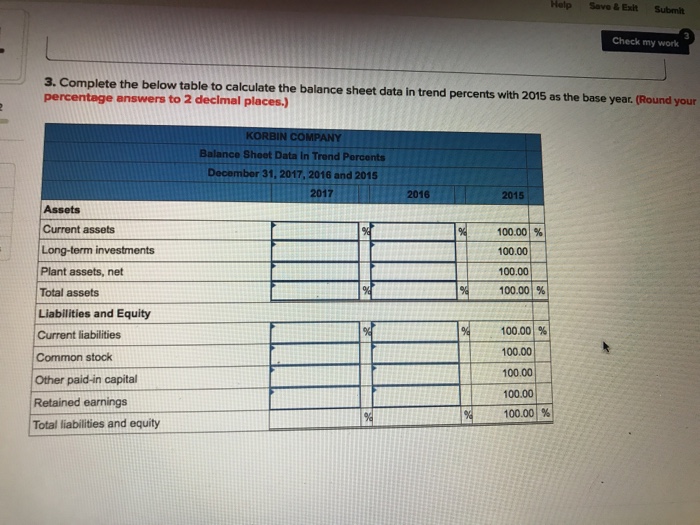 4 Selected comparative financial statements of Korbin Company follow: Comparative Income Statements For Years Ended December 31, 2017, 2016, and 2015 Part 1 of 2 2017 2016 201 Sales Cost of goods sold Gross profit Selling expenses Administrative expenses Total expenses Income before taxes Income taxes Net income 509,563 $390,367 $270,900 31173,376 97,524 35,759 22,485 58,244 39,280 7,974 S 68,854 44,689 31,306 306,757 245,9 202,806 144,436 72,35853,871 45.8612 eBook Ask Print References 34,352 88,2235 118,219 84,587 15.733 56,213 11,524 KORBIN COMPANY Comparative Balance Sheets December 31, 2017, 2016, and 2015 2016 Assets Current assets Long-term investmentS Plant assets, net Total assets s 51,900$ 40,606 $ 54,280 4,100 58,578 900 93, 47999.662 $145,379 $141,168 116,958 Liabilities and Equity Current liabilities Common stock other paid-in capital Retained earnings Total liabilities and equity 21,225 21,03420,468 68,00068,000 50,000 5,556 47,65443,63440,934 8,500 8,500 S145,379$141,168 $116,958
Step by Step Solution
There are 3 Steps involved in it
Step: 1

Get Instant Access with AI-Powered Solutions
See step-by-step solutions with expert insights and AI powered tools for academic success
Step: 2

Step: 3
Ace Your Homework with AI
Get the answers you need in no time with our AI-driven, step-by-step assistance
Get Started