

Answered step by step
Verified Expert Solution
Question
1 Approved Answer
4. Suppose that you were hired as finance consultant of PT Bank Mandiri Tbk. Download the firm ual Report. Mention the issues and possible solutions
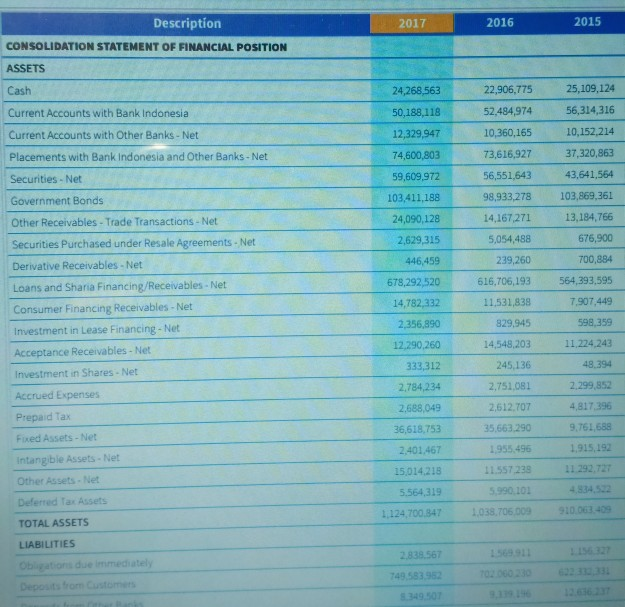
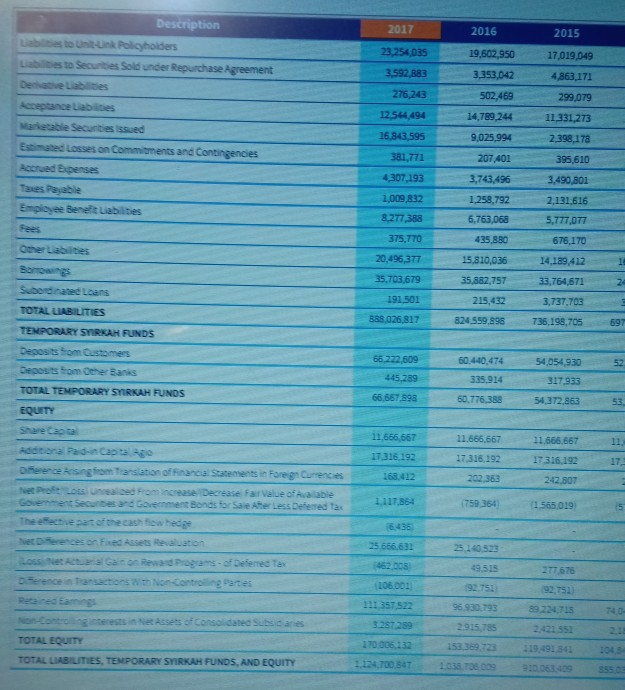
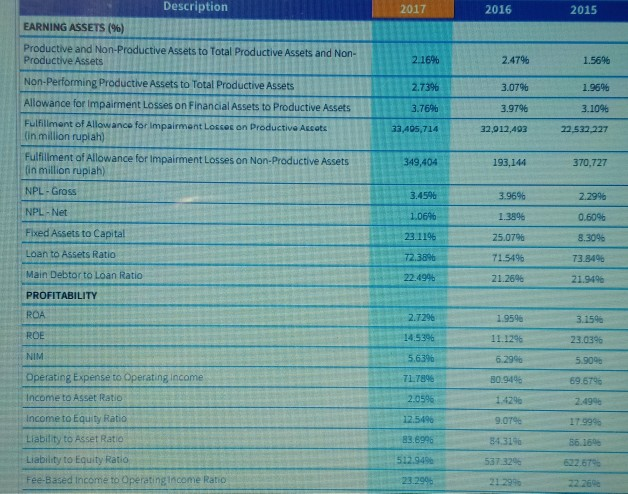
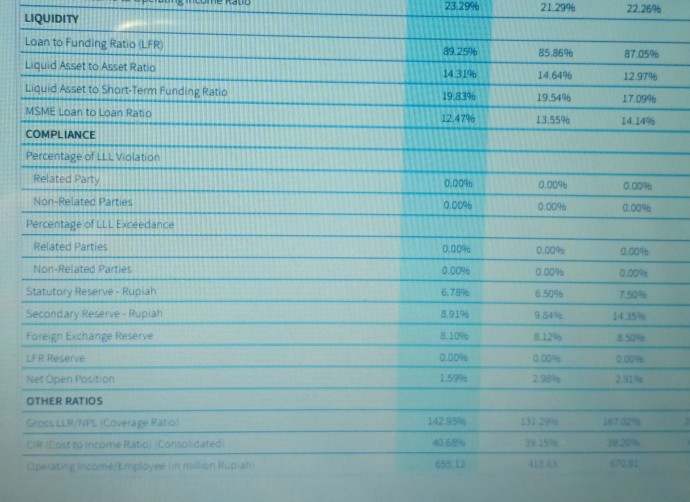
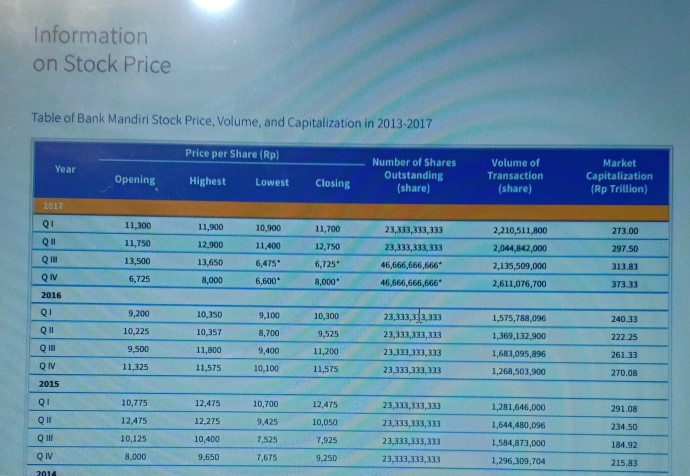
4. Suppose that you were hired as finance consultant of PT Bank Mandiri Tbk. Download the firm ual Report. Mention the issues and possible solutions of estimating the firm cost of capital! (30 points) Description 2017 2016 2015 CONSOLIDATION STATEMENT OF FINANCIAL POSITION ASSETS Cash Current Accounts with Bank Indonesia Current Accounts with Other Banks- Net 24,268,563 50,188,118 12,329,947 74,600,803 59,609,972 103,411,188 24,090,128 2,629,315 446,459 678,292,520 14,782,332 2.356,890 12.290,260 333,312 2.784,234 2,688,049 36,618,753 2.401.467 15,014,218 5.564,319 25,109,124 52.484,974 56,314,316 10,152,214 37,320,863 43,641,564 98,933,278 103,869,361 13,184,766 676,900 700,884 616,706,193 564,393,595 7.907,449 598,359 11,224,243 48.394 2.299,852 4,817.396 9,761,688 1,915,192 11 292,727 22,906,775 10,360,165 73,616,927 56,551,643 Placements with Bank Indonesia and Other Banks-Net Securities-Net Government Bonds Other Receivables -Trade Transactions - Net Securities Purchased under Resale Agreements-Net Derivative Receivables- Net Loans and Sharia Financing/Receivables- Net Consumer Financing Receivables -Net investment in Lease Financing Net Acceptance Receivables- Net Investment in Shares -Net Accrued Expenses Prepaid Tax Fixed Assets- Net intangible Assets-Net Other Assets Net Deferred Tax Assets 14,167,271 5,054,488 239,260 11,531,838 829,945 14,548,203 245,136 2,751.081 2,612.707 5,663 290 1955496 11.557 238 5.990 101 1,124,700.847 1038,706.009 TOTAL ASSETS LIABILITIES 2838.567 49 583.952 2017 2016 2015 Lablities to Unit-Uink Policyhoiders Labilibes to Securities Sold under Repurchase Agreement Decvative Liablities 17,019,049 4,363,171 299,079 11 331,273 2.398,178 395,610 3.353,042 502,469 14,789 244 12,544,49 Marketable Secunties issued Estimated Losses on Accrued Bxpenses Taies Payabile Employee Benet Liabilities 4307,193 1,009,832 8.277,388 375,770 20,496,317 35,703,679 191,501 207,401 3,743,496 1,258,792 6,763,068 435,880 2,131,616 5,777,07 676,170 14,189,412 5733,764,671 3,737,703 Other Lablites 581003 14183,412 5,882,7 Subord nated Loans TOTAL LIABILITIES TEMPORARY SIRKAH FUNDS Deposits trom Customers 215,432 824 559,598 736,198,705 697 6044047454,054 930 445 759 335,914 317,933 TOTAL TEMPORARY SYIRKAH FUNDS 60.776.38854372.86353 66.667 598 11,666.667 17316,192 163.412 1.117,864 6436 25.666.632 17,316.192 17 316.192 ofeence Arsingfiom Trarslaton ofFinancial Statements in Fore gn Currenc es Net Pofeoss Unrealced Fomincrease Decrease Fairvalue of Avalable 759364) (1,565,019) Government Securibes and Government Bonds for Sale Ater Less Defemed Tas The efectve pat of thecash fica hecge iet Dferences on Fxed Assets Revaluaton Lossi Net Actuara Gan on Rewand Programs- of Deiemed Tas 277 676 92 751 89 224,715 96.930,793 2915,785 151369,723 124,700.847 1038 706 009 111 357 522 74.0 Reared Earnings Non-Controllogioterests in Net Asses of consolidated Subsic anies 3257 299 19,491841 TOTAL LIABILITIES, TEMPORARY SYR AH FUNDS, AND EQUITY 910.0634s Description 2017 2016 2015 | EARNING ASSETS (%) Productive and Non-Productive Assets to Total Productive Assets and Non- Productive Assets Non-Performing Productive Assets to Total Productive Assets Allowance for impairment Losses on Financial Assets to Productive Assets Fulfillment of Allowanco for impairment Losses on Productive Assats 2.16% 2.73% 3.76% 33,405,714 2.47% 3.07% 3.97% 32,012,493 1.56% 1.96% 3.10% 22 532 227 (in million rupiah) Fulfillment of Allowance for Impairment Losses on Non-Productive Assets 349,404 193,144 370,727 in million rupiah) NPL-Gross NPL Net Fixed Assets to Capital Loan to Assets Ratio Main Debtor to Loan Ratio PROFITABILITY ROA ROE NIM Operating Expense to Operating income Income to Asset Ratio income to Equity Ratio Liability to Asset Ratio Liability to Equity Ratio Fee-Based Income to Operating income Ratio 3.45% 1.06% 3.1196 3.96% 1.38% 25.07% 71.54% 21.26% 2.29% 0.60% 8.30% 73.84% 21.94% 22.49% 2.7296 14,53% 5.63% 1.78% 2.05% 12.54% 83.8996 512.9496 23.29% 1.95% 1 1.12% 6.29% B0.94% 1.42% 9.07% 84.31% 537.32% 21.29% 3.15% 23.03% 5.90% 69.67% 1799% 622.67% 22 269a 23.29% 21.29% 22.26% LIQUIDITY Loan to Funding Ratio (LFR) Liquid Asset to Asset Ratio Liquid Asset to Short-Term Funding Ratio MSME Loan to Loan Ratio COMPLIANCE 89.25% 14.31% 19A3% 12.47% 85.86% 14.646 19.5496 13.55% 87.05% 12.97% 17.09% 14, 1496 Percentage of LL Violation Related Party 0.00% 0 00% 0.00% Non-Related Parties 0.00% 0.00% 0.00% Percentage of LLL Exceedance Related Parties Non-Related Partis Statutory Reserv- Rupiah Secondary Reserve-Rupiah Foreign Exchange Reserve LFR Reserve Net Open Position OTHER RATIOS GOs LLRNPL Coverage Ratio CRCost to income Rato Consolidated Operatingincome mployee in milion Rupa 0.00% 0.009% 6.78 8.91% 8.10% 0.00% 159% 0.00% 0.00% 6.50% 9.84% 8. 12% 0.00% 0.00% 0.00% 7.50% 1435 850% 000% 2.91% 142.95% 131 29% 18702% 4068% Information on Stock Price Table of Bank Mandiri Stock Price, Volume, and Capitalization in 2013-2017 Price per Share (Rp) Opening, Highest Lowest Closing Number of Shares Outstanding share) Volume of Transaction (share) Market Capitalization (Rp Trillion) Year 11,300 11,750 13,500 6,725 11,900 12,900 13,650 8,000 10,900 11,400 6,475* 6,600 11,700 12,750 6,725* 8,000* 23,333,333,333 23,333,333,333 46,666,666,666 46,666,666,666 2,210,511,800 2,044,842,000 2,135,509,000 2,611,076,700 273.00 297.50 313.83 373.33 Q IV 2016 9,200 10,225 9,500 11,325 10,350 10,357 11,800 11,575 9,100 8,700 9,400 10,100 10,300 9,525 11,200 11,575 23,333,333,333 23,333,333,333 23,333,333,333 23,333,333,333 1,575,788,096 1,369,132,900 1,683,095,896 1,268,503,900 240.33 222.25 261.33 270.08 2015 10,775 12,475 10,125 8,000 12,475 12,275 10,400 9,650 10,700 9,425 7,525 7,6T5 12,475 10,050 7,925 9,250 23,333,333,333 23,333,333,333 23,333,333,333 23,333,333,333 1,281,646,000 1,644,480,096 1,584,873,000 1,296,309,704 291.08 234.50 184.92 215.83 4. Suppose that you were hired as finance consultant of PT Bank Mandiri Tbk. Download the firm ual Report. Mention the issues and possible solutions of estimating the firm cost of capital! (30 points) Description 2017 2016 2015 CONSOLIDATION STATEMENT OF FINANCIAL POSITION ASSETS Cash Current Accounts with Bank Indonesia Current Accounts with Other Banks- Net 24,268,563 50,188,118 12,329,947 74,600,803 59,609,972 103,411,188 24,090,128 2,629,315 446,459 678,292,520 14,782,332 2.356,890 12.290,260 333,312 2.784,234 2,688,049 36,618,753 2.401.467 15,014,218 5.564,319 25,109,124 52.484,974 56,314,316 10,152,214 37,320,863 43,641,564 98,933,278 103,869,361 13,184,766 676,900 700,884 616,706,193 564,393,595 7.907,449 598,359 11,224,243 48.394 2.299,852 4,817.396 9,761,688 1,915,192 11 292,727 22,906,775 10,360,165 73,616,927 56,551,643 Placements with Bank Indonesia and Other Banks-Net Securities-Net Government Bonds Other Receivables -Trade Transactions - Net Securities Purchased under Resale Agreements-Net Derivative Receivables- Net Loans and Sharia Financing/Receivables- Net Consumer Financing Receivables -Net investment in Lease Financing Net Acceptance Receivables- Net Investment in Shares -Net Accrued Expenses Prepaid Tax Fixed Assets- Net intangible Assets-Net Other Assets Net Deferred Tax Assets 14,167,271 5,054,488 239,260 11,531,838 829,945 14,548,203 245,136 2,751.081 2,612.707 5,663 290 1955496 11.557 238 5.990 101 1,124,700.847 1038,706.009 TOTAL ASSETS LIABILITIES 2838.567 49 583.952 2017 2016 2015 Lablities to Unit-Uink Policyhoiders Labilibes to Securities Sold under Repurchase Agreement Decvative Liablities 17,019,049 4,363,171 299,079 11 331,273 2.398,178 395,610 3.353,042 502,469 14,789 244 12,544,49 Marketable Secunties issued Estimated Losses on Accrued Bxpenses Taies Payabile Employee Benet Liabilities 4307,193 1,009,832 8.277,388 375,770 20,496,317 35,703,679 191,501 207,401 3,743,496 1,258,792 6,763,068 435,880 2,131,616 5,777,07 676,170 14,189,412 5733,764,671 3,737,703 Other Lablites 581003 14183,412 5,882,7 Subord nated Loans TOTAL LIABILITIES TEMPORARY SIRKAH FUNDS Deposits trom Customers 215,432 824 559,598 736,198,705 697 6044047454,054 930 445 759 335,914 317,933 TOTAL TEMPORARY SYIRKAH FUNDS 60.776.38854372.86353 66.667 598 11,666.667 17316,192 163.412 1.117,864 6436 25.666.632 17,316.192 17 316.192 ofeence Arsingfiom Trarslaton ofFinancial Statements in Fore gn Currenc es Net Pofeoss Unrealced Fomincrease Decrease Fairvalue of Avalable 759364) (1,565,019) Government Securibes and Government Bonds for Sale Ater Less Defemed Tas The efectve pat of thecash fica hecge iet Dferences on Fxed Assets Revaluaton Lossi Net Actuara Gan on Rewand Programs- of Deiemed Tas 277 676 92 751 89 224,715 96.930,793 2915,785 151369,723 124,700.847 1038 706 009 111 357 522 74.0 Reared Earnings Non-Controllogioterests in Net Asses of consolidated Subsic anies 3257 299 19,491841 TOTAL LIABILITIES, TEMPORARY SYR AH FUNDS, AND EQUITY 910.0634s Description 2017 2016 2015 | EARNING ASSETS (%) Productive and Non-Productive Assets to Total Productive Assets and Non- Productive Assets Non-Performing Productive Assets to Total Productive Assets Allowance for impairment Losses on Financial Assets to Productive Assets Fulfillment of Allowanco for impairment Losses on Productive Assats 2.16% 2.73% 3.76% 33,405,714 2.47% 3.07% 3.97% 32,012,493 1.56% 1.96% 3.10% 22 532 227 (in million rupiah) Fulfillment of Allowance for Impairment Losses on Non-Productive Assets 349,404 193,144 370,727 in million rupiah) NPL-Gross NPL Net Fixed Assets to Capital Loan to Assets Ratio Main Debtor to Loan Ratio PROFITABILITY ROA ROE NIM Operating Expense to Operating income Income to Asset Ratio income to Equity Ratio Liability to Asset Ratio Liability to Equity Ratio Fee-Based Income to Operating income Ratio 3.45% 1.06% 3.1196 3.96% 1.38% 25.07% 71.54% 21.26% 2.29% 0.60% 8.30% 73.84% 21.94% 22.49% 2.7296 14,53% 5.63% 1.78% 2.05% 12.54% 83.8996 512.9496 23.29% 1.95% 1 1.12% 6.29% B0.94% 1.42% 9.07% 84.31% 537.32% 21.29% 3.15% 23.03% 5.90% 69.67% 1799% 622.67% 22 269a 23.29% 21.29% 22.26% LIQUIDITY Loan to Funding Ratio (LFR) Liquid Asset to Asset Ratio Liquid Asset to Short-Term Funding Ratio MSME Loan to Loan Ratio COMPLIANCE 89.25% 14.31% 19A3% 12.47% 85.86% 14.646 19.5496 13.55% 87.05% 12.97% 17.09% 14, 1496 Percentage of LL Violation Related Party 0.00% 0 00% 0.00% Non-Related Parties 0.00% 0.00% 0.00% Percentage of LLL Exceedance Related Parties Non-Related Partis Statutory Reserv- Rupiah Secondary Reserve-Rupiah Foreign Exchange Reserve LFR Reserve Net Open Position OTHER RATIOS GOs LLRNPL Coverage Ratio CRCost to income Rato Consolidated Operatingincome mployee in milion Rupa 0.00% 0.009% 6.78 8.91% 8.10% 0.00% 159% 0.00% 0.00% 6.50% 9.84% 8. 12% 0.00% 0.00% 0.00% 7.50% 1435 850% 000% 2.91% 142.95% 131 29% 18702% 4068% Information on Stock Price Table of Bank Mandiri Stock Price, Volume, and Capitalization in 2013-2017 Price per Share (Rp) Opening, Highest Lowest Closing Number of Shares Outstanding share) Volume of Transaction (share) Market Capitalization (Rp Trillion) Year 11,300 11,750 13,500 6,725 11,900 12,900 13,650 8,000 10,900 11,400 6,475* 6,600 11,700 12,750 6,725* 8,000* 23,333,333,333 23,333,333,333 46,666,666,666 46,666,666,666 2,210,511,800 2,044,842,000 2,135,509,000 2,611,076,700 273.00 297.50 313.83 373.33 Q IV 2016 9,200 10,225 9,500 11,325 10,350 10,357 11,800 11,575 9,100 8,700 9,400 10,100 10,300 9,525 11,200 11,575 23,333,333,333 23,333,333,333 23,333,333,333 23,333,333,333 1,575,788,096 1,369,132,900 1,683,095,896 1,268,503,900 240.33 222.25 261.33 270.08 2015 10,775 12,475 10,125 8,000 12,475 12,275 10,400 9,650 10,700 9,425 7,525 7,6T5 12,475 10,050 7,925 9,250 23,333,333,333 23,333,333,333 23,333,333,333 23,333,333,333 1,281,646,000 1,644,480,096 1,584,873,000 1,296,309,704 291.08 234.50 184.92 215.83
Step by Step Solution
There are 3 Steps involved in it
Step: 1

Get Instant Access to Expert-Tailored Solutions
See step-by-step solutions with expert insights and AI powered tools for academic success
Step: 2

Step: 3
Ace Your Homework with AI
Get the answers you need in no time with our AI-driven, step-by-step assistance
Get Started
Financial Collateral Law And Practice
Authors: Matthias Haentjens
1st Edition
9780192557575