Answered step by step
Verified Expert Solution
Link Copied!

Question

1 Approved Answer

4. The data show an initial change in crystal violet concentration ([CV]/t) with time after mixing crystal violet and OH : From the equation for
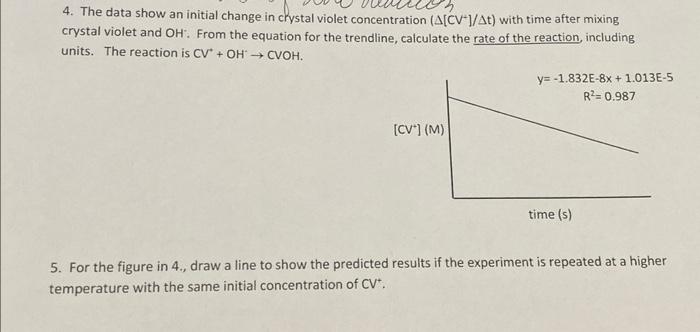
image text in transcribed
4. The data show an initial change in crystal violet concentration ([CV]/t) with time after mixing crystal violet and OH : From the equation for the trendline, calculate the rate of the reaction, including units. The reaction is CV++OHCVOH. 5. For the figure in 4., draw a line to show the predicted results if the experiment is repeated at a higher temperature with the same initial concentration of CV+

Step by Step Solution

There are 3 Steps involved in it

Step: 1

blur-text-image

Get Instant Access to Expert-Tailored Solutions

See step-by-step solutions with expert insights and AI powered tools for academic success

Step: 2

blur-text-image

Step: 3

blur-text-image

Ace Your Homework with AI

Get the answers you need in no time with our AI-driven, step-by-step assistance

Get Started

Recommended Textbook for

Chemistry

Authors: Jill Robinson, John McMurry, Robert Fay

8th Edition

134856236, 978-0134856230

More Books

Students also viewed these Chemistry questions

Question

3-18. An advertisement for peanut butter?

Answered: 1 week ago