Answered step by step
Verified Expert Solution
Question
1 Approved Answer
4. The following data were taken from Ration's 2007-2009 annual reports Ration Company Millions of $s 2007 2008 2009 Sales $ 45,187 $ 30,910 $
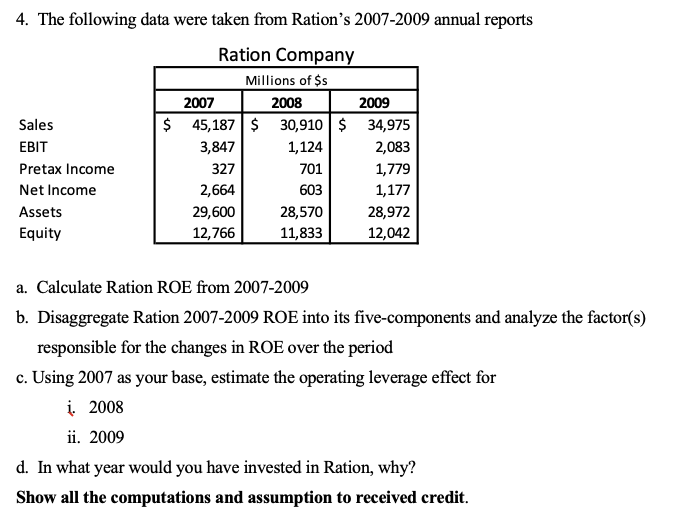
4. The following data were taken from Ration's 2007-2009 annual reports Ration Company Millions of $s 2007 2008 2009 Sales $ 45,187 $ 30,910 $ 34,975 EBIT 3,847 1,124 2,083 Pretax Income 327 701 1,779 Net Income 2,664 603 1,177 Assets 29,600 28,570 28,972 Equity 12,766 11,833 12,042 a. Calculate Ration ROE from 2007-2009 b. Disaggregate Ration 2007-2009 ROE into its five-components and analyze the factor(s) responsible for the changes in ROE over the period c. Using 2007 as your base, estimate the operating leverage effect for i 2008 ii. 2009 d. In what year would you have invested in Ration, why? Show all the computations and assumption to received credit
Step by Step Solution
There are 3 Steps involved in it
Step: 1
Get Instant Access to Expert-Tailored Solutions
See step-by-step solutions with expert insights and AI powered tools for academic success
Step: 2
Step: 3
Ace Your Homework with AI
Get the answers you need in no time with our AI-driven, step-by-step assistance
Get Started