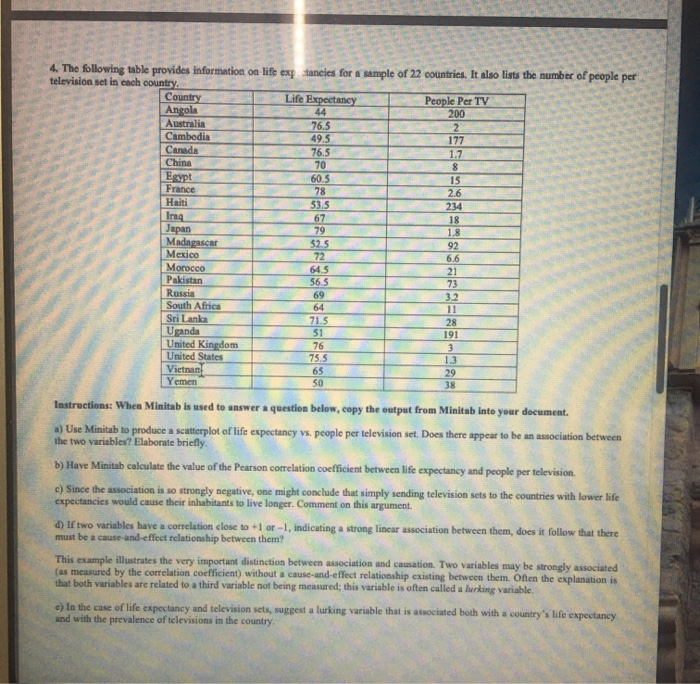
4. The following table provides information on life exp television set in each country. tancies for a sample of 22 countries. It alsso lists the number of people per Life Expectancy Country Angola People Per TV 200 2 177 44 Australia Cambodia 76.5 49.5 76.5 Canada China Egypt France 1.7 8 70 60.5 78 53.5 15 2.6 Haiti 234 Iraq Japan Madagascar Mexico 67 79 18 1,8 52.5 72 92 6.6 Morocco Pakistan Russia South Africa Sri Lanka Uganda United Kingdom United States Vietnan Yemen 64.5 56.5 21 73 3.2 11 69 64 71.5 51 76 75.5 28 191 1.3 65 50 29 38 Instructions: When Minitab is used to answer a question below, copy the output from Minitab into your document. a) Use Minitab to produce a scatterplot of life expectancy vs. people per television set. Does there appear to be an association between the two variables? Elaborate briefly b) Have Minitab calculate the value of the Pearson correlation coefficient between life expectancy and people per television c) Since the association is so strongly negative, one might conclude that simply sending television sets to the countries with lower life expectancies would cause their inhabitants to live longer. Comment on this argument d) If two variables have a correlation close to +1 or -1, indicating a strong linear association between them, does it follow that there must be a cause-and-effect relationship between them? This example illustrates the very important distinction between association and causation. Two variables may be strongly associated (as measured by the correlation coefficient) without a cause-and-effect relationship existing between them. Often the explanation is that both variables are related to a third variable not being measured; this variable is often called a hurking variable. e) In the case of life expectancy and television sets, suggest a lurking variable that is associated both with a country's life expectancy and with the prevalence of televisions in the country. 4. The following table provides information on life exp television set in each country. tancies for a sample of 22 countries. It alsso lists the number of people per Life Expectancy Country Angola People Per TV 200 2 177 44 Australia Cambodia 76.5 49.5 76.5 Canada China Egypt France 1.7 8 70 60.5 78 53.5 15 2.6 Haiti 234 Iraq Japan Madagascar Mexico 67 79 18 1,8 52.5 72 92 6.6 Morocco Pakistan Russia South Africa Sri Lanka Uganda United Kingdom United States Vietnan Yemen 64.5 56.5 21 73 3.2 11 69 64 71.5 51 76 75.5 28 191 1.3 65 50 29 38 Instructions: When Minitab is used to answer a question below, copy the output from Minitab into your document. a) Use Minitab to produce a scatterplot of life expectancy vs. people per television set. Does there appear to be an association between the two variables? Elaborate briefly b) Have Minitab calculate the value of the Pearson correlation coefficient between life expectancy and people per television c) Since the association is so strongly negative, one might conclude that simply sending television sets to the countries with lower life expectancies would cause their inhabitants to live longer. Comment on this argument d) If two variables have a correlation close to +1 or -1, indicating a strong linear association between them, does it follow that there must be a cause-and-effect relationship between them? This example illustrates the very important distinction between association and causation. Two variables may be strongly associated (as measured by the correlation coefficient) without a cause-and-effect relationship existing between them. Often the explanation is that both variables are related to a third variable not being measured; this variable is often called a hurking variable. e) In the case of life expectancy and television sets, suggest a lurking variable that is associated both with a country's life expectancy and with the prevalence of televisions in the country