Question
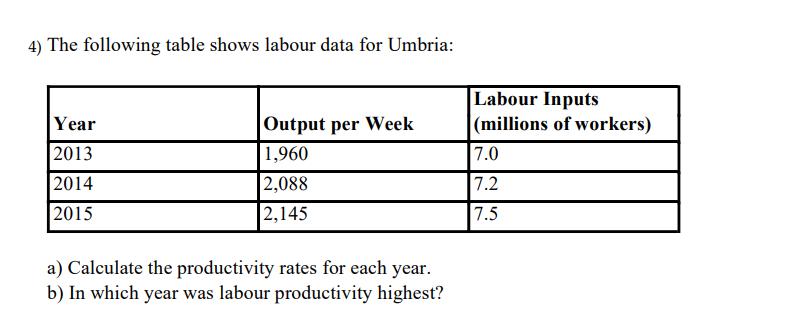
4) The following table shows labour data for Umbria: Year 2013 2014 2015 Output per Week 1,960 2,088 2,145 a) Calculate the productivity rates

4) The following table shows labour data for Umbria: Year 2013 2014 2015 Output per Week 1,960 2,088 2,145 a) Calculate the productivity rates for each year. b) In which year was labour productivity highest? Labour Inputs (millions of workers) 7.0 7.2 7.5
Step by Step Solution
There are 3 Steps involved in it
Step: 1
Certainly Lets calculate the productivity rates a Productivity Rates Producti...
Get Instant Access to Expert-Tailored Solutions
See step-by-step solutions with expert insights and AI powered tools for academic success
Step: 2

Step: 3

Ace Your Homework with AI
Get the answers you need in no time with our AI-driven, step-by-step assistance
Get StartedRecommended Textbook for
Operations Management
Authors: William J Stevenson
12th edition
2900078024107, 78024102, 978-0078024108
Students also viewed these Economics questions
Question
Answered: 1 week ago
Question
Answered: 1 week ago
Question
Answered: 1 week ago
Question
Answered: 1 week ago
Question
Answered: 1 week ago
Question
Answered: 1 week ago
Question
Answered: 1 week ago
Question
Answered: 1 week ago
Question
Answered: 1 week ago
Question
Answered: 1 week ago
Question
Answered: 1 week ago
Question
Answered: 1 week ago
Question
Answered: 1 week ago
Question
Answered: 1 week ago
Question
Answered: 1 week ago
Question
Answered: 1 week ago
Question
Answered: 1 week ago
Question
Answered: 1 week ago
Question
Answered: 1 week ago
Question
Answered: 1 week ago
Question
Answered: 1 week ago
View Answer in SolutionInn App


