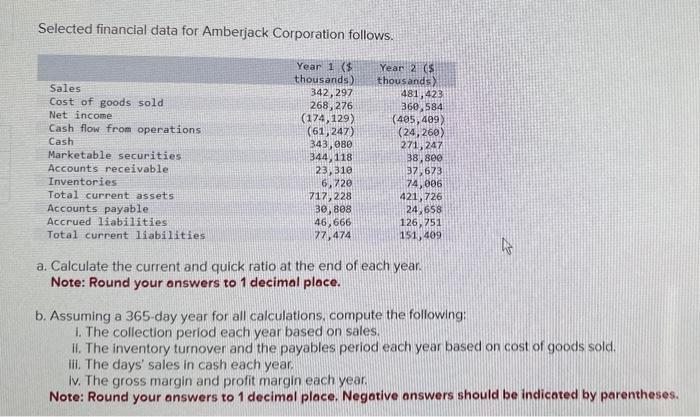
Selected financial data for Amberjack Corporation follows. Year 1 ($ thousands). 342,297 268, 276 (174,129) (61,247) Sales Cost of goods sold Net income Cash

Selected financial data for Amberjack Corporation follows. Year 1 ($ thousands). 342,297 268, 276 (174,129) (61,247) Sales Cost of goods sold Net income Cash flow from operations Cash Marketable securities Accounts receivable Inventories Total current assets Accounts payable Accrued liabilities. Total current liabilities 343,080 344,118 23,310 6,720 717,228 30,808 46,666 77,474 Year 2 (S thousands) 481,423 360,584 (405,409) (24,260) 271,247 38,800 37,673 74,006 421,726 24,658 126,751 151,409 a. Calculate the current and quick ratio at the end of each year. Note: Round your answers to 1 decimal place. b. Assuming a 365-day year for all calculations, compute the following: 1. The collection period each year based on sales. II. The inventory turnover and the payables period each year based on cost of goods sold. ili. The days' sales in cash each year. Iv. The gross margin and profit margin each year. Note: Round your answers to 1 decimal place. Negative answers should be indicated by parentheses.
Step by Step Solution
There are 3 Steps involved in it
Step: 1
a Lets calculate the current ratio and quick ratio for each year Year 1 Current Ratio Total Current ...
See step-by-step solutions with expert insights and AI powered tools for academic success
Step: 2

Step: 3

Ace Your Homework with AI
Get the answers you need in no time with our AI-driven, step-by-step assistance
Get Started


