

Answered step by step
Verified Expert Solution
Question
1 Approved Answer
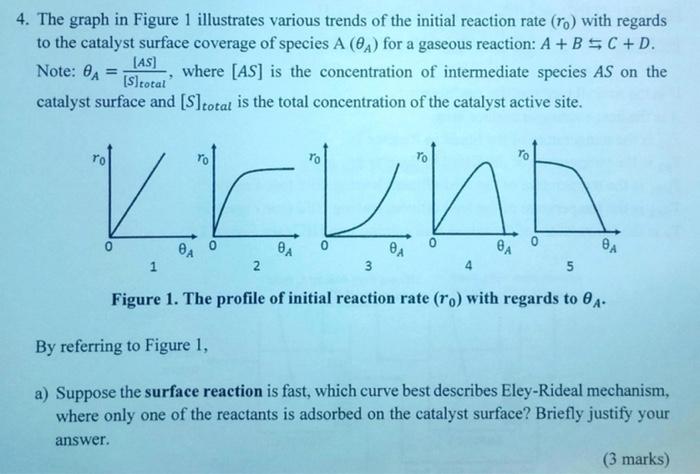
4. The graph in Figure 1 illustrates various trends of the initial reaction rate (ro) with regards to the catalyst surface coverage of species A
Step by Step Solution
There are 3 Steps involved in it
Step: 1

Get Instant Access to Expert-Tailored Solutions
See step-by-step solutions with expert insights and AI powered tools for academic success
Step: 2

Step: 3
Ace Your Homework with AI
Get the answers you need in no time with our AI-driven, step-by-step assistance
Get Started
Thermodynamics Concepts And Applications
Authors: Stephen R. Turns
1st Edition
0521850428, 9780521850421