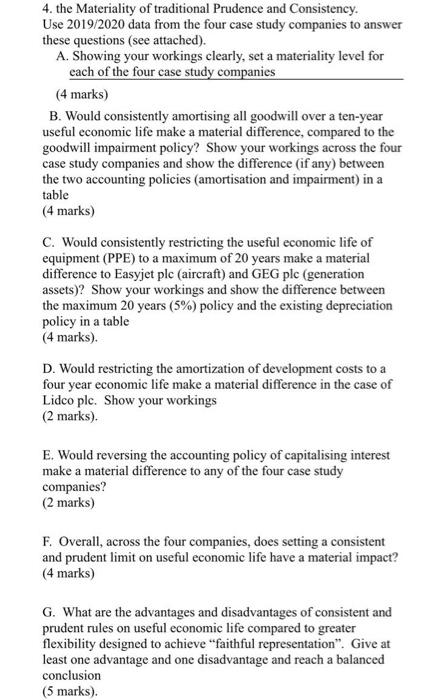
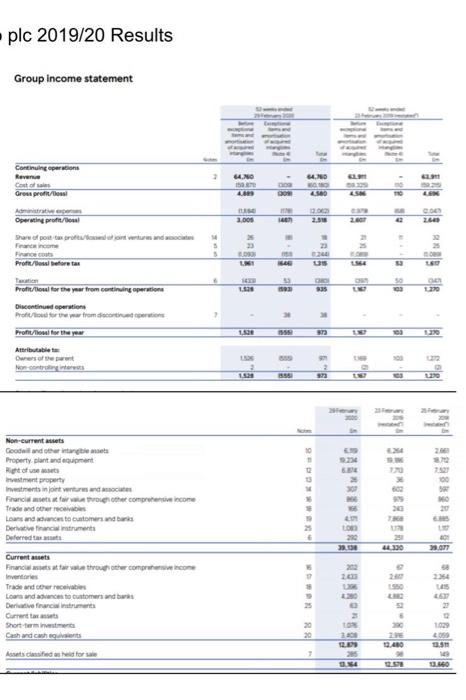
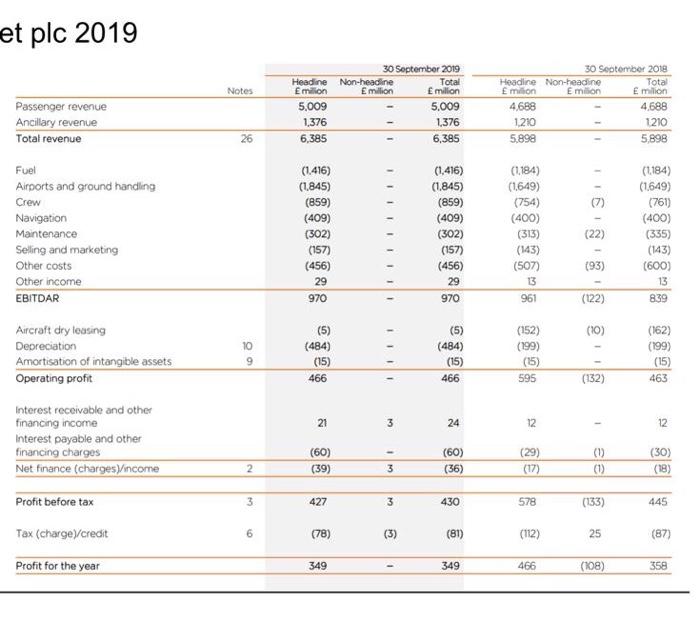
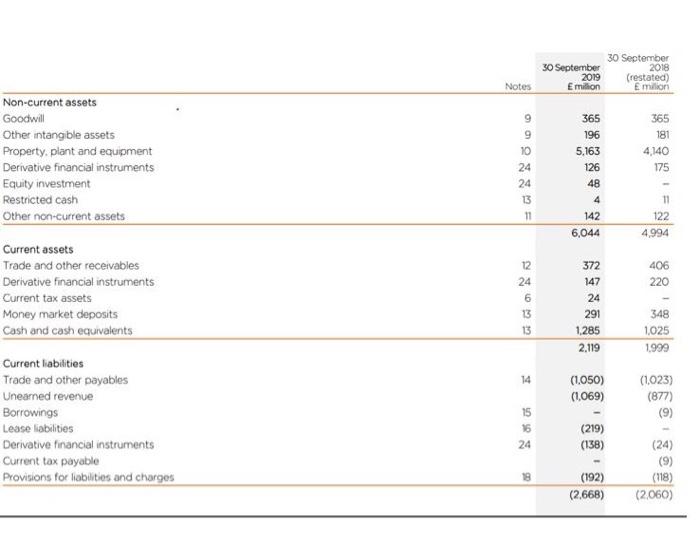
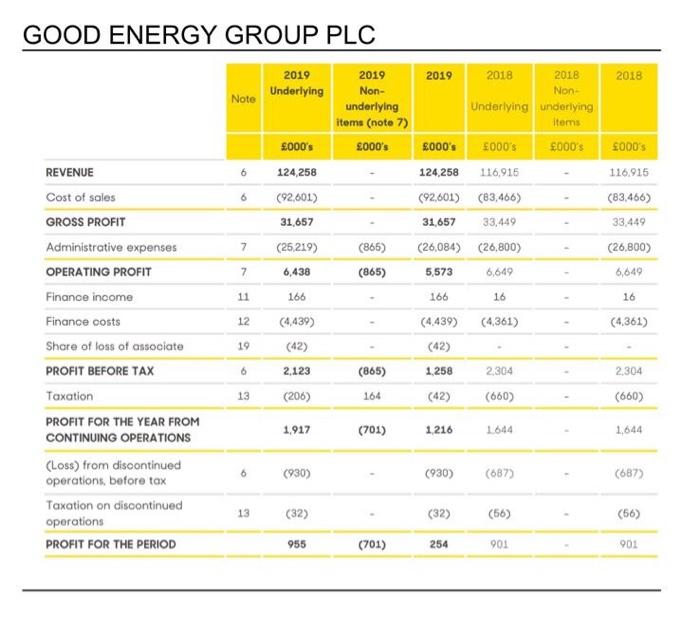
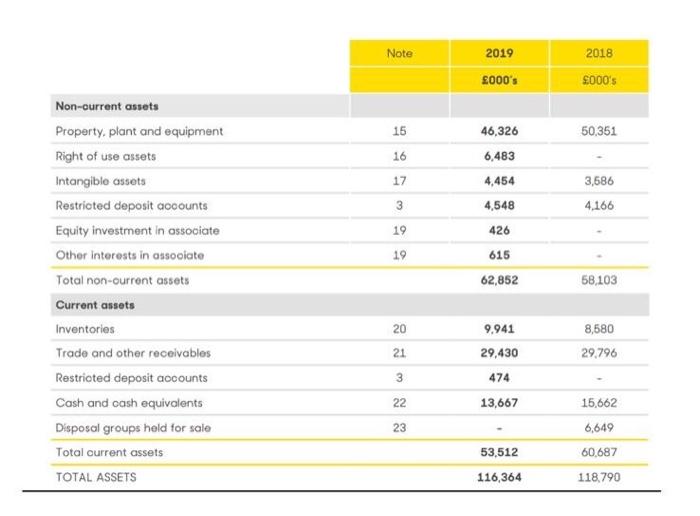
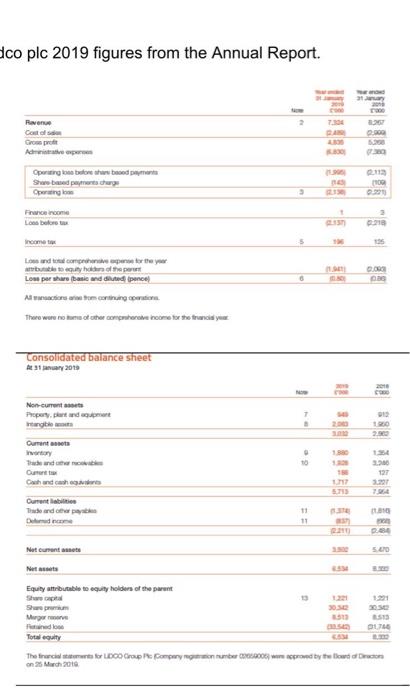
4. the Materiality of traditional Prudence and Consistency. Use 2019/2020 data from the four case study companies to answer these questions (see attached). A. Showing your workings clearly, set a materiality level for cach of the four case study companies (4 marks) B. Would consistently amortising all goodwill over a ten-year useful economic life make a material difference, compared to the goodwill impairment policy? Show your workings across the four case study companies and show the difference (if any) between the two accounting policies (amortisation and impairment) in a table (4 marks) C. Would consistently restricting the useful economic life of equipment (PPE) to a maximum of 20 years make a material difference to Easyjet plc (aircraft) and GEG plc (generation assets)? Show your workings and show the difference between the maximum 20 years (5%) policy and the existing depreciation policy in a table (4 marks). D. Would restricting the amortization of development costs to a four year economic life make a material difference in the case of Lidco ple. Show your workings (2 marks) E. Would reversing the accounting policy of capitalising interest make a material difference to any of the four case study companies? (2 marks) F. Overall, across the four companies, does setting a consistent and prudent limit on useful economic life have a material impact? (4 marks) G. What are the advantages and disadvantages of consistent and prudent rules on useful economic life compared to greater flexibility designed to achieve "faithful representation". Give at least one advantage and one disadvantage and reach a balanced conclusion (5 marks). - plc 2019/20 Results Group Income statement . Continuing operation Cost of Gross profit/los! 64.NO 150 4.500 TO 3.00 2. Share pot groot versand 20 25 23 Profesora LI 50 35 Profit/ou for the year from continuing operations Discontinued operation 1. . 15 395 1230 0 > Non-currentes Good and Property plant and equipment Right of Investment property Intents in joint ventures France competence Trade and other Loans and custo customers and bars Derivaterratruments Deferred 491 20 42330 Current sets Financiare thout comprome 1 Looms and acces to customers and burns Dertificaments Current Short-term 6 20 20 1929 200 3.5m Assets and for alle 0 3.860 et plc 2019 Notes Passenger revenue Ancillary revenue Total revenue 30 September 2019 Headline Non-headine Total Emillion Emilion Emillion 5,009 5.009 1,376 1376 6,385 6,385 30 September 2018 Headline Non-headine Total milion Emilion Emilion 4.688 4.688 1.210 1210 5,898 5,898 It 26 Fuel Airports and ground handling Crew Navigation Maintenance Seling and marketing Other costs Other income EBITDAR (1.416) (1.845) (859) (409) (302) (157) (456) 29 970 1 II III III (1,416) (1.845) (859) (409) (302) (157) (456) 29 970 (1,184) (1.649) (754) (400) (313) (143) (507) 13 (22) (1184) (1649) (761) (400) (335) (143) (600) 13 839 (93) 961 (122) (10) (5) (484) (152) (199) Aircraft dry leasing Depreciation Amortisation of intangible assets Operating profit (5) (484) (15) 466 10 9 III 1 (162) (199) (15) 463 (15) 466 595 (132) 21 3 24 12 1 12 Interest receivable and other financing income Interest payable and other financing charges Net finance (charges)/income (60) (39) (60) (36) (29) (17) 2 ( (1) (30) (18) 2 3 3 Profit before tax 3 427 3 430 578 (133) 445 Tax (charge/credit 6 (78) (3) (81) (112) 25 (87) Profit for the year 349 349 466 (108) 358 30 September 2019 Emillion 30 September 2018 (restated) Emilion Notes Non-current assets Goodwill Other intangible assets Property, plant and equipment Derivative financial instruments Equity investment Restricted cash Other non-current assets 365 181 4,140 175 9 10 24 24 13 11 365 196 5,163 126 48 4 142 6,044 11 122 4.994 Current assets Trade and other receivables Derivative financial instruments Current tax assets Money market deposits Cash and cash equivalents 406 220 12 24 6 13 13 372 147 24 291 348 1,285 2.119 1,025 1.999 14 (1.050) (1,069) Current liabilities Trade and other payables Uneamed revenue Borrowings Lease liabilities Derivative financial instruments Current tax payable Provisions for liabilities and charges (1.023) (877) (9) 15 16 24 (219) (138) (192) (2,668) (24) (9) (118) (2,060) GOOD ENERGY GROUP PLC 2019 Underlying 2019 2018 Note 2019 Non- underlying items (noto 7) 2000's 2000's 124,258 2018 2018 Non Underlying underlying items 2000's 2000's 2000's 124,258 116,915 (92,001) (83,466) 31,657 33,449 (26,084) (26,800) 000's 116916 6 6 (83.466) (92,601) 31,657 33,449 7 (26219) (866) (26,800) 7 6,438 (865) 5,573 6,649 6,649 11 166 166 16 16 12 (4,361) (4.361) (4,439) (42) (4.439) (42) 19 - REVENUE Cost of soles GROSS PROFIT Administrative expenses OPERATING PROFIT Finance income Finance costs Shore of loss of associate PROFIT BEFORE TAX Taxation PROFIT FOR THE YEAR FROM CONTINUING OPERATIONS (Loss) from discontinued operations before tax Taxation on discontinued operations PROFIT FOR THE PERIOD 6 2.123 (865) 1258 2304 - 2,304 13 (206) 164 (42) (660) (660) 1.917 (701) 1216 1644 1,644 6 (930) (930) (687) (687) 13 (32) (32) (56) (56) 955 (701) 254 901 901 Note 2019 000's 2018 000's 15 50,351 46,326 6,483 16 17 4,454 3,586 3 4,548 4,166 19 426 615 19 62,852 58.103 Non-current assets Property, plant and equipment Right of use assets Intangible assets Restricted deposit accounts Equity investment in associate Other interests in associate Total non-current assets Current assets Inventories Trade and other receivables Restricted deposit accounts Cash and cash equivalents Disposal groups held for sale Total current assets TOTAL ASSETS 20 9,941 29,430 8,580 29.796 21 3 474 22 13,667 15,662 23 6,649 53,512 60,687 116,364 118,790
