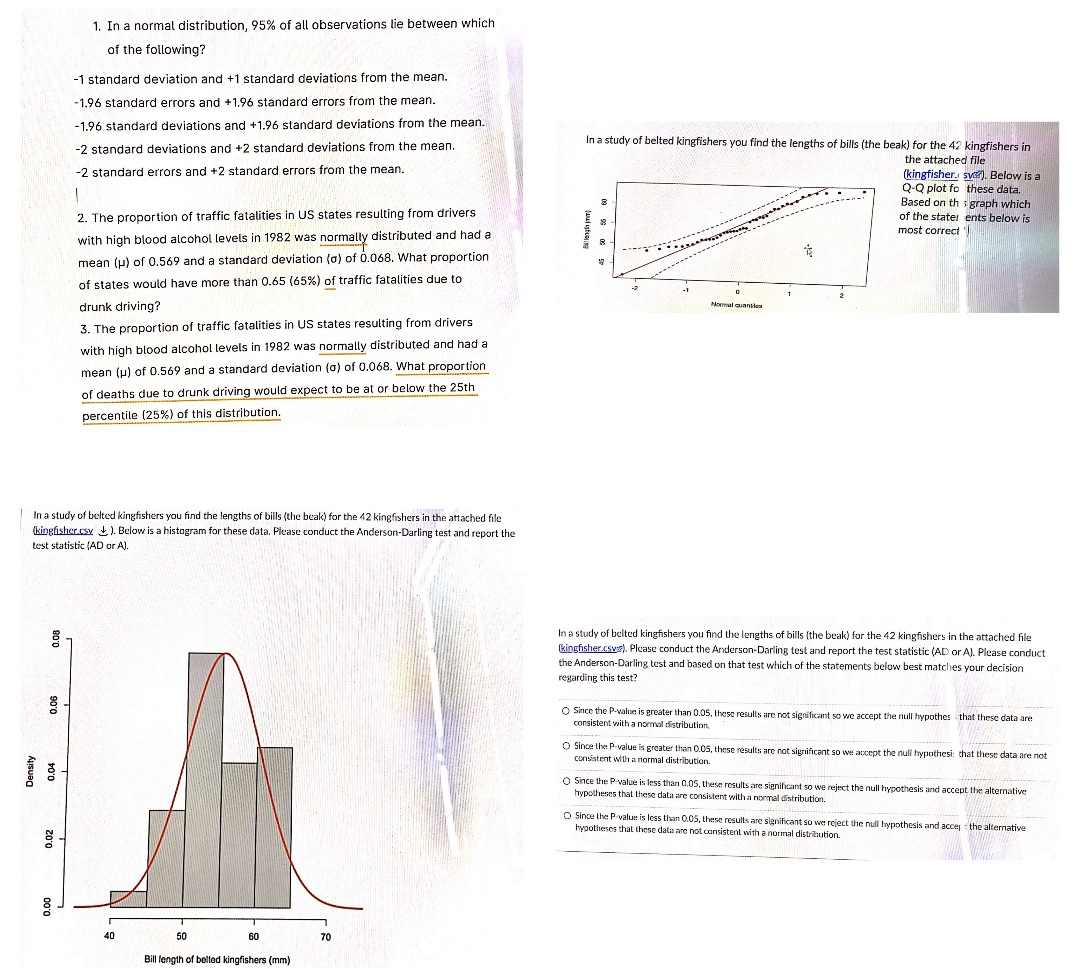
4. The MCAT is a standardized test for admission to medical schools. A student wanting to become a doctor takes the MCAT and scores a 27. Of all the students that took this exam the average was 2.50 (u-population mean) and the standard deviation was 6.4. What proportion of students got that score or lower on the MCAT ? What proportion of students got that score or higher on the MCAT? The picture on the upper right, it says based on the graph which statements is most correct? The statements are; a.) these data appear NOT to be consistent with a normal distribution. b.) These data appear to be consistent with a normal distribution. For the historgram below, we need to report the test statistics, and the P value as well which will help figure out the last question. Thank you.
1. In a normal distribution, 95% of all observations lie between which of the following? 1 standard deviation and +1 standard deviations from the mean. -1.96 standard errors and +1.96 standard errors from the mean. -1.96 standard deviations and +1.96 standard deviations from the mean. -2 standard deviations and +2 standard deviations from the mean. In a study of belted kingfishers you find the lengths of bills (the beak) for the 42 kingfishers in the attached file 2 standard errors and +2 standard errors from the mean. (kingfisher. sves). Below is a Q-Q plot fo these data. Based on this graph which 2. The proportion of traffic fatalities in US states resulting from drivers of the stater ents below is Bill langh [ TIT 50 56 most correct ' with high blood alcohol levels in 1982 was normally distributed and had a mean () of 0.569 and a standard deviation (o) of 0.068. What proportion of states would have more than 0.65 (65%) of traffic fatalities due to drunk driving? Normal quantlen 5. The proportion of traffic fatalities in US states resulting from drivers with high blood alcohol levels in 1982 was normally distributed and had a mean () of 0.569 and a standard deviation (a) of 0.068. What proportion of deaths due to drunk driving would expect to be at or below the 25th percentile (25%) of this distribution. In a study of belted kingfishers you find the lengths of bills (the beak) for the 42 kingfishers in the attached file kingfisher csy + ). Below is a histogram for these data. Please conduct the Anderson-Darling test and report the test statistic (AD or A). In a study of belted kingfishers you find the lengths of bills (the beak) for the 42 kingfishers in the attached file 0.08 kingfisher cavs). Please conduct the Anderson-Darling test and report the test statistic (AD or A). Please conduct the Anderson-Darling test and based on that test which of the statements below best matches your decision regarding this test? 0.06 O Since the P-value is greater than 0.05, these results are not significant so we accept the null hypothesis these data are consistent with a normal distribution. Since the: P-value is greater than 0.05, these results are not significant so we accept the null hypothesi: that these data are not consistent with a normal distribution Density 0.04 O Since the P-value is less than 0.05, these results are significant so we reject the null hypothesis and accept the alternative hypotheses that these data are consistent with a normal distribution. D Since the P.value is less than 0.05, these results are significant so we reject the null hypothesis and acce, t the alternative hypotheses that these data are not consistent with a normal distribution. 0.02 0.00 40 60 Bill length of belted kingfishers (mm)


