

Answered step by step
Verified Expert Solution
Question
1 Approved Answer
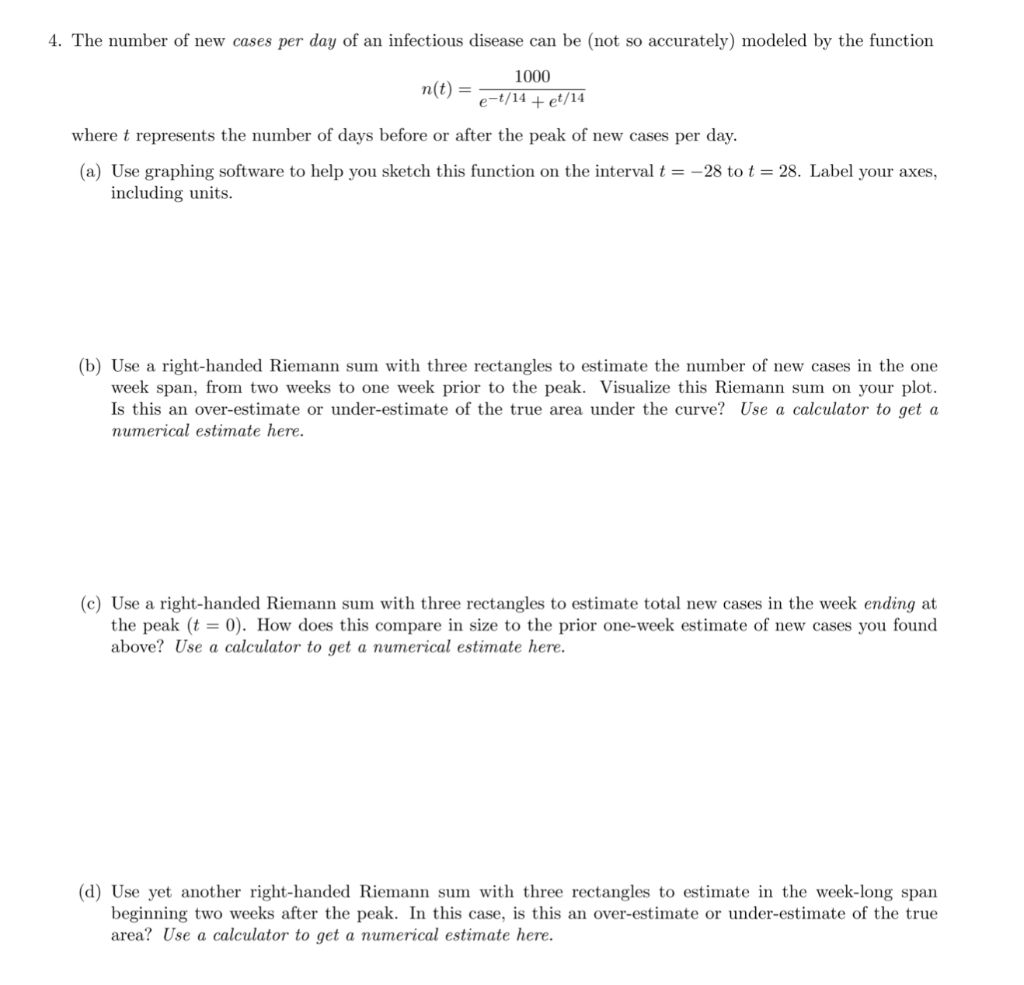
4. The number of new cases per day of an infectious disease can be (not so accurately) modeled by the function 1000 n(t) = -t/14
Step by Step Solution
There are 3 Steps involved in it
Step: 1

Get Instant Access to Expert-Tailored Solutions
See step-by-step solutions with expert insights and AI powered tools for academic success
Step: 2

Step: 3
Ace Your Homework with AI
Get the answers you need in no time with our AI-driven, step-by-step assistance
Get Started
Concept Audits A Philosophical Method
Authors: Nicholas Rescher
1st Edition
1498540392, 978-1498540391