Answered step by step
Verified Expert Solution
Link Copied!

Question

1 Approved Answer

4. The table below shows the weight of an alligator at various times during a feeding trial. Weeks 0 9 18 27 34 43 49
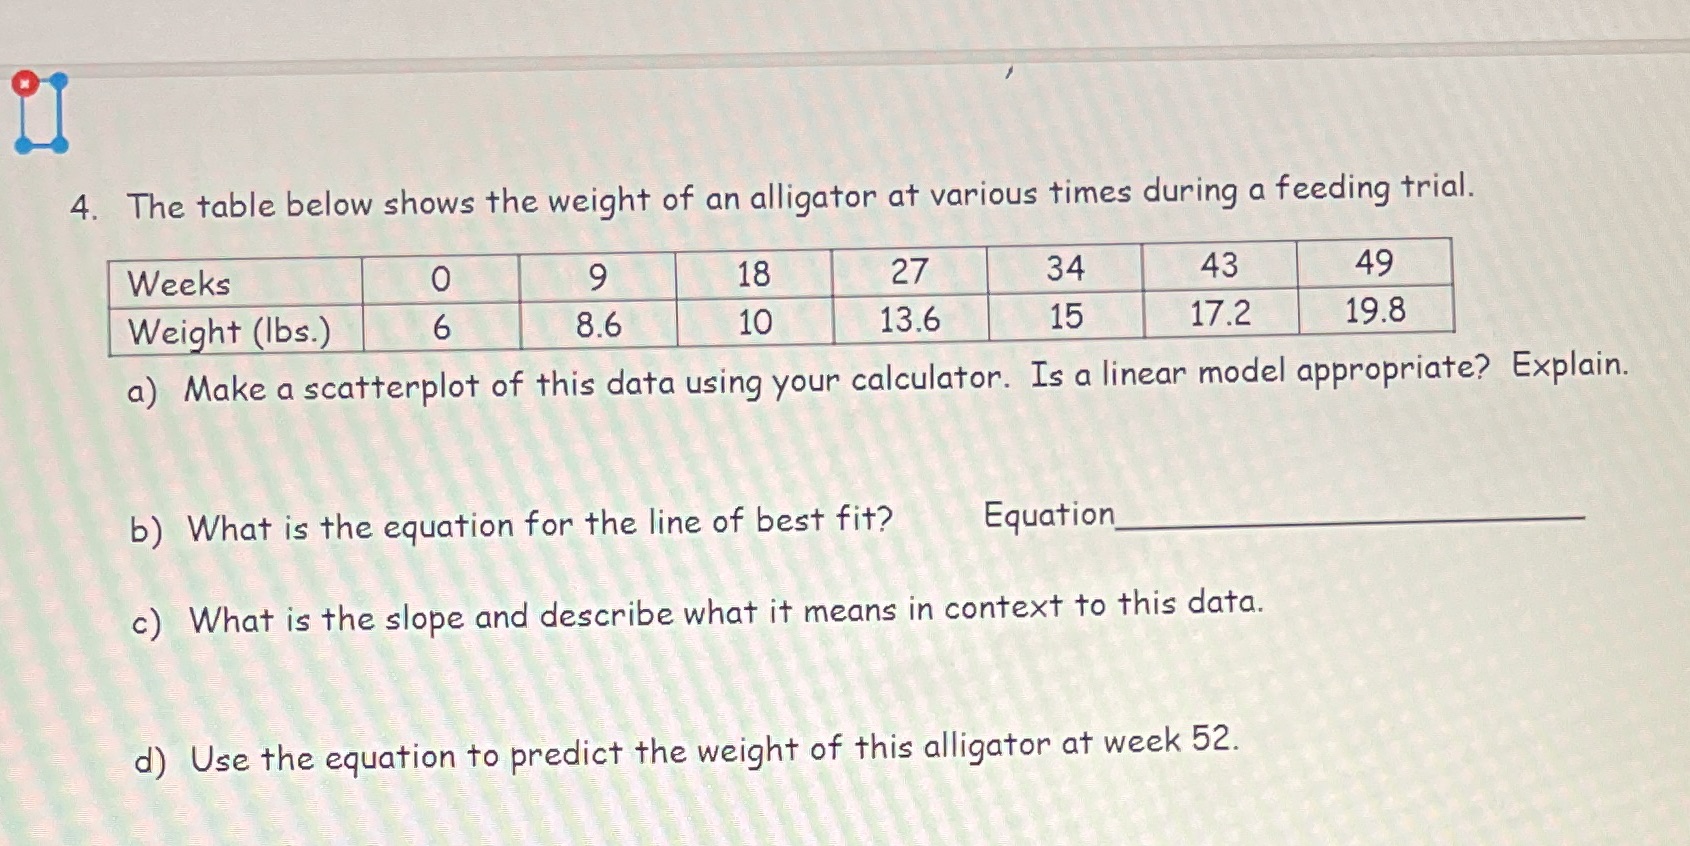
image text in transcribed
4. The table below shows the weight of an alligator at various times during a feeding trial. Weeks 0 9 18 27 34 43 49 Weight (Ibs.) 6 8.6 10 13.6 15 17.2 19.8 a) Make a scatterplot of this data using your calculator. Is a linear model appropriate? Explain. b) What is the equation for the line of best fit? Equation c) What is the slope and describe what it means in context to this data. d) Use the equation to predict the weight of this alligator at week 52

Step by Step Solution

There are 3 Steps involved in it

Step: 1

blur-text-image

Get Instant Access to Expert-Tailored Solutions

See step-by-step solutions with expert insights and AI powered tools for academic success

Step: 2

blur-text-image

Step: 3

blur-text-image

Ace Your Homework with AI

Get the answers you need in no time with our AI-driven, step-by-step assistance

Get Started

Recommended Textbook for

Square Summable Power Series

Authors: Louis De Branges, James Rovnyak

1st Edition

0486801365, 9780486801360

More Books

Students also viewed these Mathematics questions

Question

b. Where did they come from?

Answered: 1 week ago