

Answered step by step
Verified Expert Solution
Question
1 Approved Answer
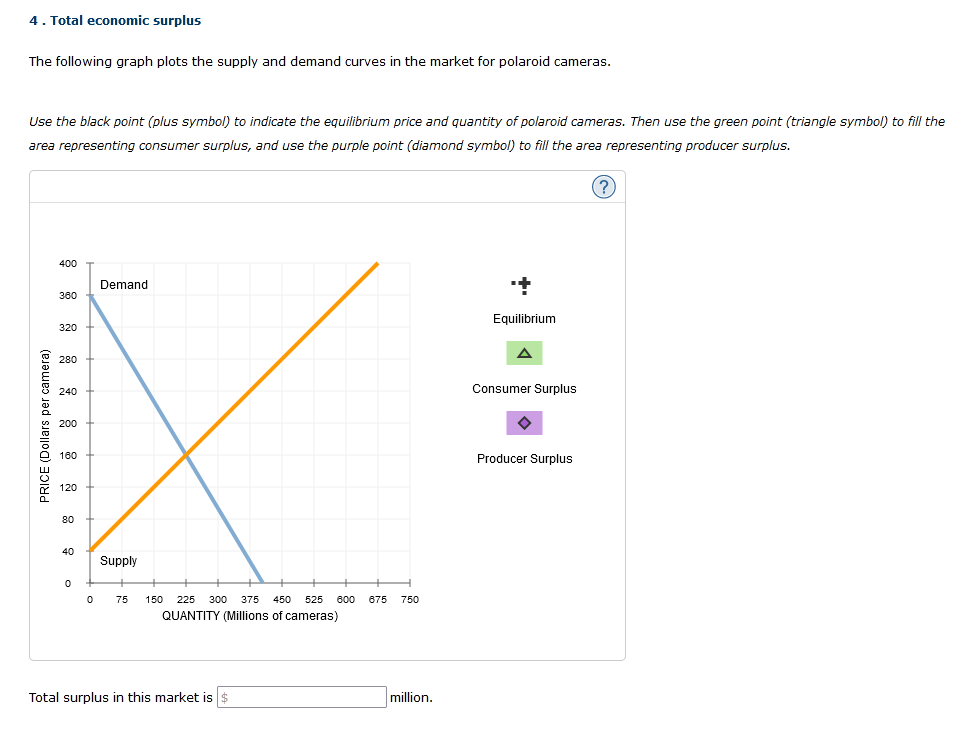
4 . Total economic surplus The following graph plots the supply and demand curves in the market for polaroid cameras. Use the black point (plus
Step by Step Solution
There are 3 Steps involved in it
Step: 1

Get Instant Access to Expert-Tailored Solutions
See step-by-step solutions with expert insights and AI powered tools for academic success
Step: 2

Step: 3
Ace Your Homework with AI
Get the answers you need in no time with our AI-driven, step-by-step assistance
Get Started
How China Escaped Shock Therapy The Market Reform Debate
Authors: Isabella M Weber
1st Edition
0429953968, 9780429953965