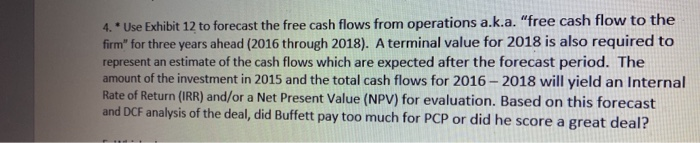
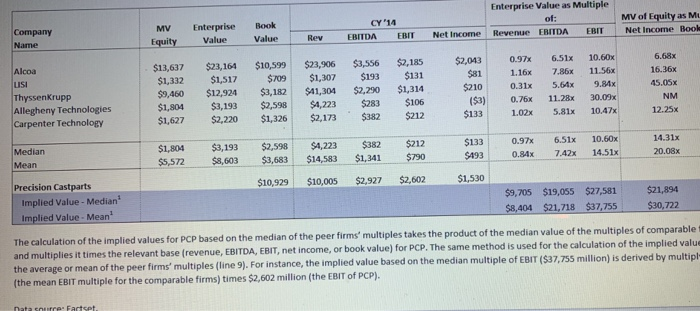
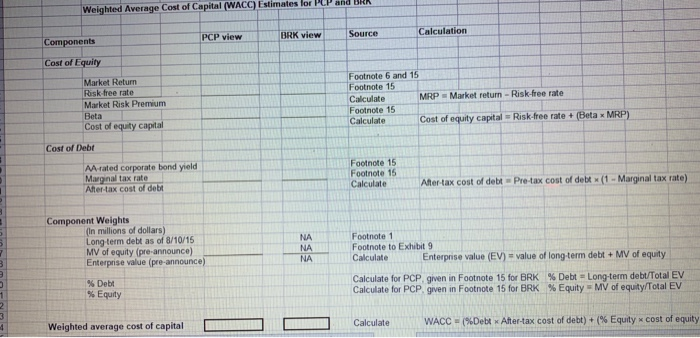
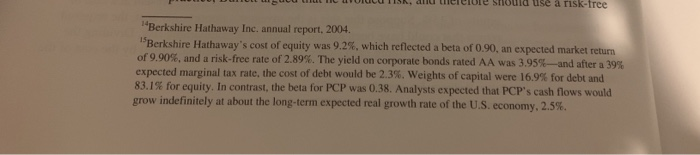
4. . Use Exhibit 12 to forecast the free cash flows from operations a.k.a. "free cash flow to the firm" for three years ahead (2016 through 2018). A terminal value for 2018 is also required to represent an estimate of the cash flows which are expected after the forecast period. The amount of the investment in 2015 and the total cash flows for 2016-2018 will yield an Internal Rate of Return (IRR) and/or a Net Present Value (NPV) for evaluation. Based on this forecast and DCF analysis of the deal, did Buffett pay too much for PCP or did he score a great deal? Enterprise Value as Multiple of: MV of Equity as M CY '14 MV Enterprise Book Company Name Equity ValueValue Rev EBITDA EBIT Net Income Revenue EBITDA EBITNet Income Bool $2,043 0.97x 6.51x 10.60x $81 1.16x 7.86x 1156x $210 0.31x 5.64x 9.81x ($3) 0.76x 11.28x 30.09x $133 1.02x 5.31x 10.47x! 6.68x $13,637 $23,164 $10,599 $23,906 $3,556 $2,185 $709 $1,307 $193 $131 $9,460 $12,924 $3,182 $41,304 $2,290 $1,314 $1804 $3,193 $2,598 $4,223$283 $106 $1,627 $2,220 $1,326 $2,173 $382 $212 11.56x45,.05x Alcoa LUSI Thyssenkrupp Allegheny Technologies Carpenter TechnologY $1,332 $1,517 NM 12.25x $133 0.97x 6.51x 10.60x $493 -0.84x 7.42x 14-51x 14.31x 0.08x $1,804 $3,193 $2,598 $4,223 $382 $212 $5,572 $8,603 $3,683 $14,583 1,341 $790 10,929 $10,005 $2,927 $2,602 Median Mean $1,530 Precision Castparts Implied Value-Median Implied Value- Mean $9,705 $19,055 $27,581 $21,894 $8,404 $21,718 $37,755 $30,722 he implied values for PCP based on the median of the peer firms multiples takes the product of the median value of the mul PCP. The same method is used for the calculation of the implied valu ian multiple of EBIT (S37,755 million) is derived by multipl and multiplies it times the relevant base (revenue, EBITDA, EBIT, net income, or book value) for the average or mean of the peer firms' multiples (line 9). For instance, the implied value based on the med the mean EBIT multiple for the comparable firms) times $2,602 million (the EBIT of PCP). Weighted Average Cost of Capital (WACC) Estimates lor PLP and BRA P view BRK view Source Calculation Components Cost of Equity Market Return Risk tree rate Market Risk Premium Beta Cost of equity c Footnote 6 and 15 Footnote 15 CalculateMRP Footnote 15 Calculate Market return-Risk-free rate Cost of equity c # Risk-free rate+(Beta x Cost of Debt AA-rated corporate bond yield Marginal tax rate After tax cost of deb Footnote 15 Footnote 15 Calculate Ater-tax cost of debt Pre-tax cost of debt x (1- Marginal tax rate) Component Weights In millions of dollars) Long-term debt as of 8/10/15 MV of equity (pre-announce) Enterprise value (pre-announce) Footnote 1 Calculate Enterpnise value (EV) value of long-term debt + MV of equity Calculate for PCP, given in Footnote 15 for BRK % Debt Long-term debt/Total EV NA NAFootnote to Exhibit 9 NA %Debt- % Equity Calculate for PCP. gven n Footnote 15 for BRK % Equity-MV of equity/Total EV Weighted average cost of capital Calculate WACC . Debt x After-tax cost of debt) + (% Equity cost of equity "Berkshire Hathaway Inc. annual report, 2004. "Berkshire Hathaway's cost of equity was 9.2%, which reflected a beta of 0.90, an expected market return of 9.90%, and a risk-free rate of 2.89%. The yield on corporate bonds rated AA was 3.95%--and after a 39% expected marginal tax rate, the cost of debt would be 2.3%. weights of capital were 16.9% for debt and 83.1% for equity. In contrast, the beta for PCP was 0.38. Analysts expected that PCP's cash flows would grow indefinitely at about the long-term expected real growth rate of the U.S. economy, 2.5%. 4. . Use Exhibit 12 to forecast the free cash flows from operations a.k.a. "free cash flow to the firm" for three years ahead (2016 through 2018). A terminal value for 2018 is also required to represent an estimate of the cash flows which are expected after the forecast period. The amount of the investment in 2015 and the total cash flows for 2016-2018 will yield an Internal Rate of Return (IRR) and/or a Net Present Value (NPV) for evaluation. Based on this forecast and DCF analysis of the deal, did Buffett pay too much for PCP or did he score a great deal? Enterprise Value as Multiple of: MV of Equity as M CY '14 MV Enterprise Book Company Name Equity ValueValue Rev EBITDA EBIT Net Income Revenue EBITDA EBITNet Income Bool $2,043 0.97x 6.51x 10.60x $81 1.16x 7.86x 1156x $210 0.31x 5.64x 9.81x ($3) 0.76x 11.28x 30.09x $133 1.02x 5.31x 10.47x! 6.68x $13,637 $23,164 $10,599 $23,906 $3,556 $2,185 $709 $1,307 $193 $131 $9,460 $12,924 $3,182 $41,304 $2,290 $1,314 $1804 $3,193 $2,598 $4,223$283 $106 $1,627 $2,220 $1,326 $2,173 $382 $212 11.56x45,.05x Alcoa LUSI Thyssenkrupp Allegheny Technologies Carpenter TechnologY $1,332 $1,517 NM 12.25x $133 0.97x 6.51x 10.60x $493 -0.84x 7.42x 14-51x 14.31x 0.08x $1,804 $3,193 $2,598 $4,223 $382 $212 $5,572 $8,603 $3,683 $14,583 1,341 $790 10,929 $10,005 $2,927 $2,602 Median Mean $1,530 Precision Castparts Implied Value-Median Implied Value- Mean $9,705 $19,055 $27,581 $21,894 $8,404 $21,718 $37,755 $30,722 he implied values for PCP based on the median of the peer firms multiples takes the product of the median value of the mul PCP. The same method is used for the calculation of the implied valu ian multiple of EBIT (S37,755 million) is derived by multipl and multiplies it times the relevant base (revenue, EBITDA, EBIT, net income, or book value) for the average or mean of the peer firms' multiples (line 9). For instance, the implied value based on the med the mean EBIT multiple for the comparable firms) times $2,602 million (the EBIT of PCP). Weighted Average Cost of Capital (WACC) Estimates lor PLP and BRA P view BRK view Source Calculation Components Cost of Equity Market Return Risk tree rate Market Risk Premium Beta Cost of equity c Footnote 6 and 15 Footnote 15 CalculateMRP Footnote 15 Calculate Market return-Risk-free rate Cost of equity c # Risk-free rate+(Beta x Cost of Debt AA-rated corporate bond yield Marginal tax rate After tax cost of deb Footnote 15 Footnote 15 Calculate Ater-tax cost of debt Pre-tax cost of debt x (1- Marginal tax rate) Component Weights In millions of dollars) Long-term debt as of 8/10/15 MV of equity (pre-announce) Enterprise value (pre-announce) Footnote 1 Calculate Enterpnise value (EV) value of long-term debt + MV of equity Calculate for PCP, given in Footnote 15 for BRK % Debt Long-term debt/Total EV NA NAFootnote to Exhibit 9 NA %Debt- % Equity Calculate for PCP. gven n Footnote 15 for BRK % Equity-MV of equity/Total EV Weighted average cost of capital Calculate WACC . Debt x After-tax cost of debt) + (% Equity cost of equity "Berkshire Hathaway Inc. annual report, 2004. "Berkshire Hathaway's cost of equity was 9.2%, which reflected a beta of 0.90, an expected market return of 9.90%, and a risk-free rate of 2.89%. The yield on corporate bonds rated AA was 3.95%--and after a 39% expected marginal tax rate, the cost of debt would be 2.3%. weights of capital were 16.9% for debt and 83.1% for equity. In contrast, the beta for PCP was 0.38. Analysts expected that PCP's cash flows would grow indefinitely at about the long-term expected real growth rate of the U.S. economy, 2.5%