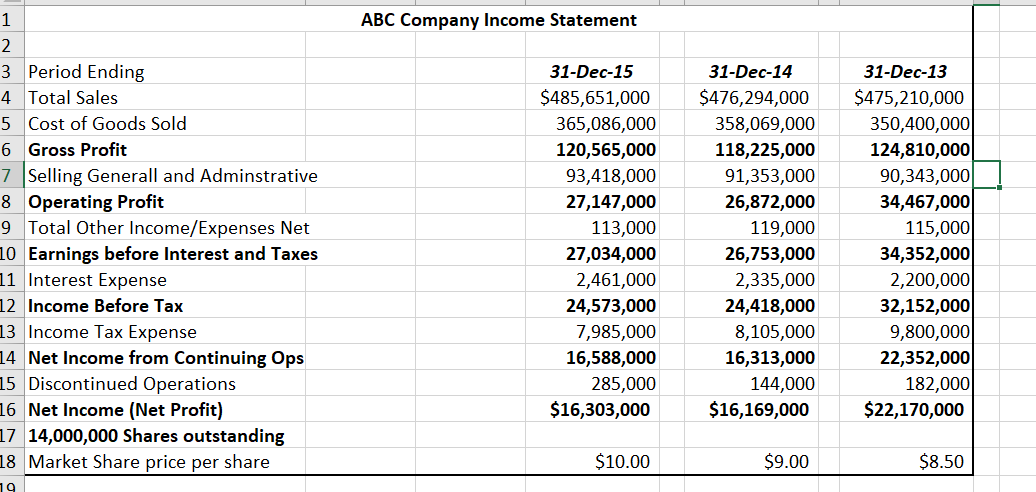
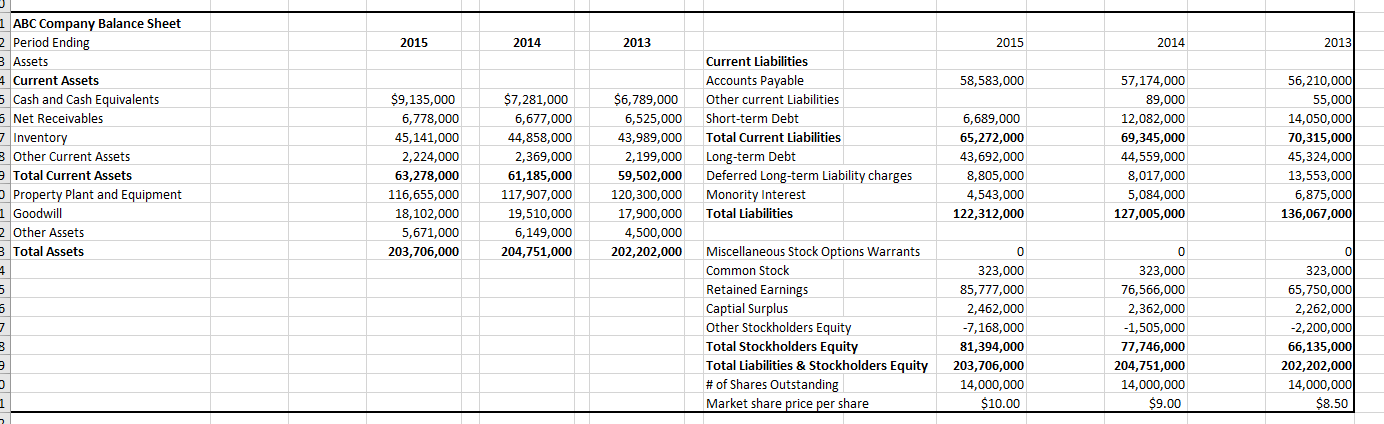
4. Using the data from the price per share data, the Income Statement, and the Balance Sheet, provide the correct calculation for the market value ratios below. Market Value Ratios Earnings per Share (EPS) Price Earnings (PE) ABC Company Income Statement 1 2 3 Period Ending 4 Total Sales 5 Cost of Goods Sold 6 Gross Profit 7 Selling Generall and Adminstrative 8 Operating Profit 9 Total Other Income/Expenses Net 10 Earnings before Interest and Taxes 11 Interest Expense 12 Income Before Tax 13 Income Tax Expense 14 Net Income from Continuing Ops 15 Discontinued Operations 16 Net Income (Net Profit) 17 14,000,000 Shares outstanding 18 Market Share price per share 19 31-Dec-15 $485,651,000 365,086,000 120,565,000 93,418,000 27,147,000 113,000 27,034,000 2,461,000 24,573,000 7,985,000 16,588,000 285,000 $16,303,000 31-Dec-14 $476,294,000 358,069,000 118,225,000 91,353,000 26,872,000 119,000 26,753,000 2,335,000 24,418,000 8,105,000 16,313,000 144,000 $16,169,000 31-Dec-13 $475,210,000 350,400,000 124,810,000 90,343,000 34,467,000 115,000 34,352,000 2,200,000 32,152,000 9,800,000 22,352,000 182,0001 $22,170,000 $10.00 $9.00 $8.50 2015 2014 2013 2015 2014 2013 58,583,000 1 ABC Company Balance Sheet 2 Period Ending 3 Assets 4 Current Assets 5 Cash and Cash Equivalents 5 Net Receivables 7 Inventory 3 Other Current Assets Total Current Assets Property Plant and Equipment 1 Goodwill Other Assets Total Assets $9,135,000 6,778,000 45,141,000 2,224,000 63,278,000 116,655,000 18,102,000 5,671,000 203,706,000 $7,281,000 6,677,000 44,858,000 2,369,000 61,185,000 117,907,000 19,510,000 6,149,000 204,751,000 $6,789,000 6,525,000 43,989,000 2,199,000 59,502,000 120,300,000 17,900,000 4,500,000 202,202,000 Current Liabilities Accounts Payable Other current Liabilities Short-term Debt Total Current Liabilities Long-term Debt Deferred Long-term Liability charges Monority Interest Total Liabilities 6,689,000 65,272,000 43,692,000 8,805,000 4,543,000 122,312,000 57,174,000 89,000 12,082,000 69,345,000 44,559,000 8,017,000 5,084,000 127,005,000 56,210,000 55,000 14,050,000 70,315,000 45,324,000 13,553,000 6,875,000 136,067,000 5 5 7 Miscellaneous Stock Options Warrants Common Stock Retained Earnings Captial Surplus Other Stockholders Equity Total Stockholders Equity Total Liabilities & Stockholders Equity # of Shares Outstanding Market share price per share 0 323,000 85,777,000 2,462,000 -7,168,000 81,394,000 203,706,000 14,000,000 $10.00 0 323,000 76,566,000 2,362,000 -1,505,000 77,746,000 204,751,000 14,000,000 $9.00 ol 323,000 65,750,000 2,262,000 -2,200,000 66,135,000 202,202,000 14,000,000 $8.50 3 3