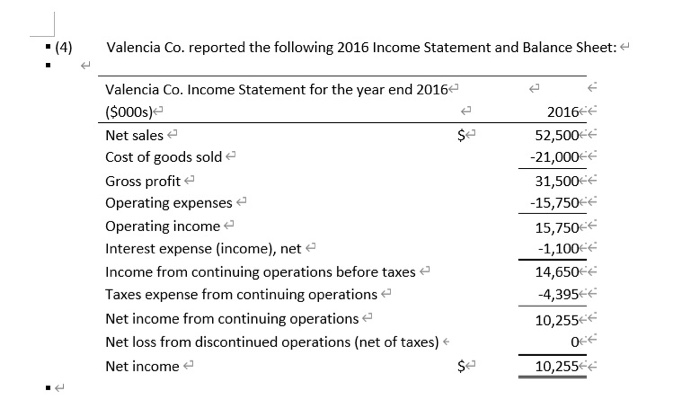
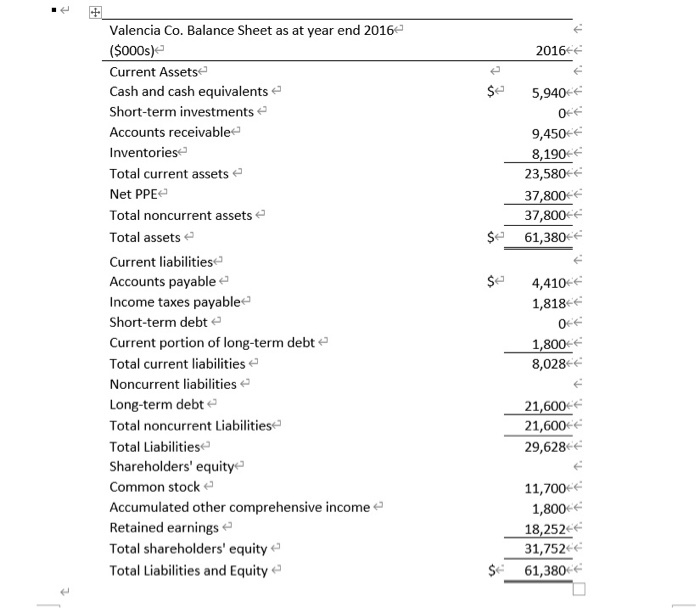
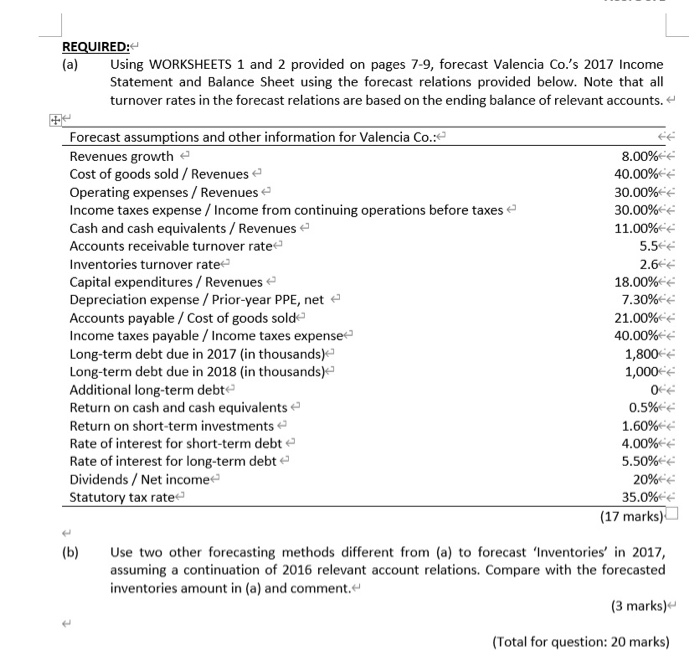
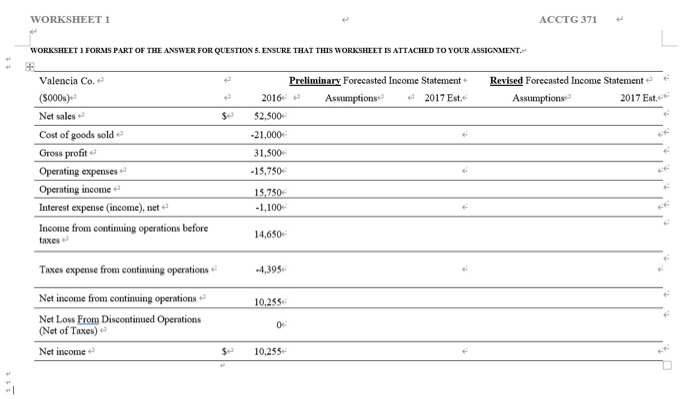
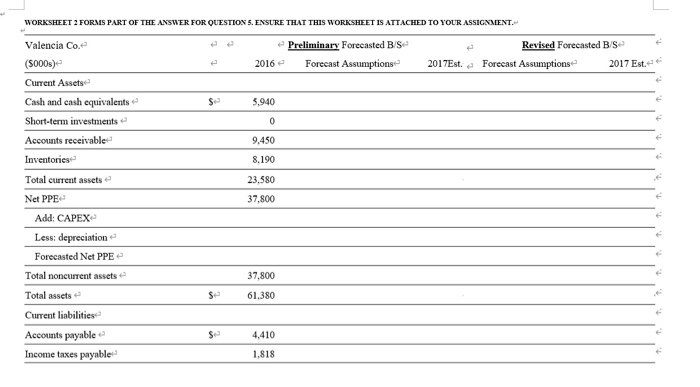
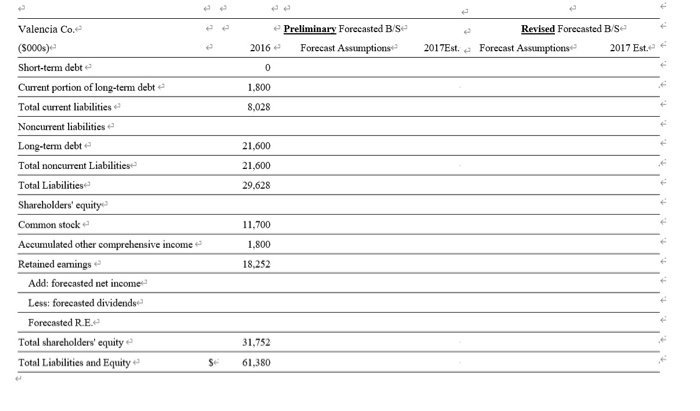
(4) Valencia Co. reported the following 2016 Income Statement and Balance Sheet: Valencia Co. Income Statement for the year end 2016 ($000s) Net salese Cost of goods solde Gross profite Operating expenses Operating income Interest expense (income), nete Income from continuing operations before taxes Taxes expense from continuing operations Net income from continuing operations Net loss from discontinued operations (net of taxes) Net income 2016 52,500 -21,000 31,500 -15,750 15,750 -1,100 14,6506 -4,39544 10,255 06 10,25564 2016 5,940 06 9,450 8,190 23,580 37,800 37,800 61,3806 $e Valencia Co. Balance Sheet as at year end 2016 ($000s) Current Assets Cash and cash equivalents Short-term investments Accounts receivable Inventoriese Total current assets Net PPE Total noncurrent assets Total assetse Current liabilities Accounts payable Income taxes payable Short-term debt e Current portion of long-term debt Total current liabilities Noncurrent liabilities Long-term debte Total noncurrent Liabilities Total Liabilities Shareholders' equity Common stock e Accumulated other comprehensive income Retained earnings Total shareholders' equity Total Liabilities and Equity 4,410 1,8186 06 1,800 8,028 21,600 21,600 29,628 11,700 1,800 18,252 31,752 61,380 $ REQUIRED: (a) Using WORKSHEETS 1 and 2 provided on pages 7-9, forecast Valencia Co.'s 2017 Income Statement and Balance Sheet using the forecast relations provided below. Note that all turnover rates in the forecast relations are based on the ending balance of relevant accounts. Forecast assumptions and other information for Valencia Co.: Revenues growth Cost of goods sold / Revenues Operating expenses / Revenues Income taxes expense / Income from continuing operations before taxes Cash and cash equivalents / Revenuese Accounts receivable turnover rate Inventories turnover rate Capital expenditures / Revenuese Depreciation expense / Prior-year PPE, net Accounts payable / Cost of goods solde Income taxes payable / Income taxes expense Long-term debt due in 2017 (in thousands) Long-term debt due in 2018 (in thousands) Additional long-term debte Return on cash and cash equivalents Return on short-term investments Rate of interest for short-term debt Rate of interest for long-term debt Dividends / Net income Statutory tax rate 8.00% 40.00% 30.00% 30.00% 11.00% 5.56 2.64 18.00% 7.30% 21.00% 40.00% 1,800 1,000+ 06 0.5% 1.60% 4.00% 5.50% 20% 35.0% (17 marks) (b) Use two other forecasting methods different from (a) to forecast 'Inventories' in 2017, assuming a continuation of 2016 relevant account relations. Compare with the forecasted inventories amount in (a) and comment. (3 marks) t (Total for question: 20 marks) WORKSHEET 1 ACCTG 371 WORKSHEET 1 FORMS PART OF THE ANSWER FOR QUESTION 5. ENSURE THAT THIS WORKSHEET IS ATTACHED TO YOUR ASSIGNMENT. Preliminary Forecasted Income Statement Assumptions 2017 Est. Revised Forecasted Income Statemente Assumptions 2017 Est. $ Valencia Co. (5000s) Net sales Cost of goods sold Gross profit Operating expenses Operating income Interest expense (income), nete Income from continuing operations before taxes 2016 52,500 -21,000 31,500 -15.750 15.750 -1.100 14,650 Taxes expense from continuing operations -4,395 10.255 Net income from continuing operations Net Loss From Discontinued Operations (Net of Taxes) Net income $ 10,255 WORKSHEET 2 FORMS PART OF THE ANSWER FOR QUESTION 5. ENSURE THAT THIS WORKSHEET IS ATTACHED TO YOUR ASSIGNMENT. - Preliminary Forecasted B/S 2016 e Forecast Assumptions Revised Forecasted B/S Forecast Assumptions 2017 Este e 2017Est. Valencia Coe (5000) Current Assets Cash and cash equivalents Short-term investments Accounts receivable $ 5.940 0 9,450 8.190 Inventoriese Total current assets 23.580 37,800 Net PPE Add: CAPEX Less: depreciation Forecasted Net PPE Total noncurrent assets 37.800 Total assets Se 61.380 Current liabilities Accounts payable Income taxes payable $ 4,410 1,818 Preliminary Forecasted B/S Forecast Assumptions Revised Forecasted B/S Forecast Assumptions 2017 Est. 2016 2017Est. 1.800 8,028 Valencia Coe (S000s) Short-term debte Current portion of long-term debt e Total current liabilities Noncurrent liabilities Long-term debt Total noncurrent Liabilities Total Liabilities Shareholders' equity Common stock 21,600 21,600 29,628 11,700 Accumulated other comprehensive income 1.800 Retained earnings 18.252 Add: forecasted net income Less: forecasted dividends Forecasted R.E. Total shareholders' equity Total Liabilities and Equity 31,752 61,380 $