Answered step by step
Verified Expert Solution
Question
1 Approved Answer
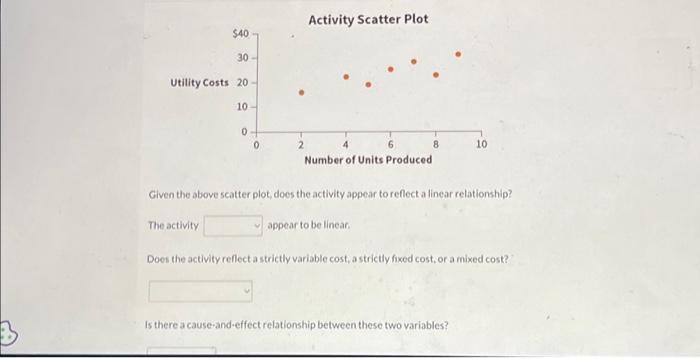
$40,- 30 Utility Costs 20 The activity 10 0+ Activity Scatter Plot 4 Number of Units Produced 6 appear to be linear. 8 Given the
$40,- 30 Utility Costs 20 The activity 10 0+ Activity Scatter Plot 4 Number of Units Produced 6 appear to be linear. 8 Given the above scatter plot, does the activity appear to reflect a linear relationship? 10 Does the activity reflect a strictly variable cost, a strictly fixed cost, or a mixed cost? Is there a cause-and-effect relationship between these two variables?
Step by Step Solution
There are 3 Steps involved in it
Step: 1

Get Instant Access to Expert-Tailored Solutions
See step-by-step solutions with expert insights and AI powered tools for academic success
Step: 2

Step: 3
Ace Your Homework with AI
Get the answers you need in no time with our AI-driven, step-by-step assistance
Get Started