

Answered step by step
Verified Expert Solution
Question
1 Approved Answer
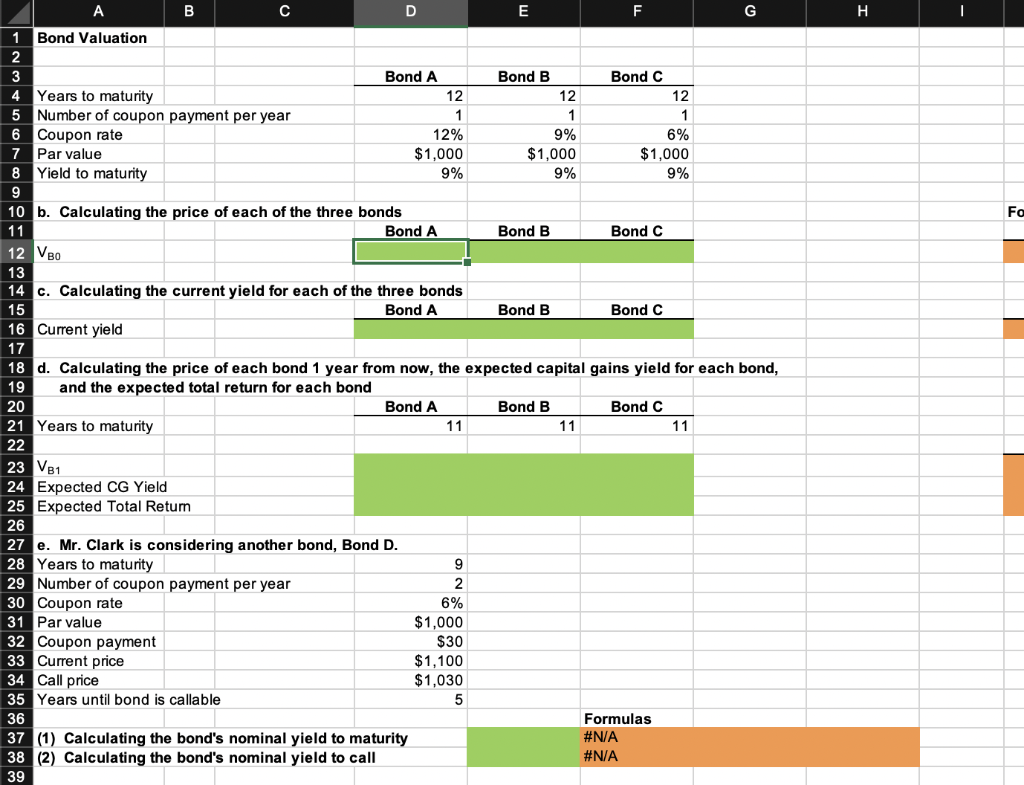
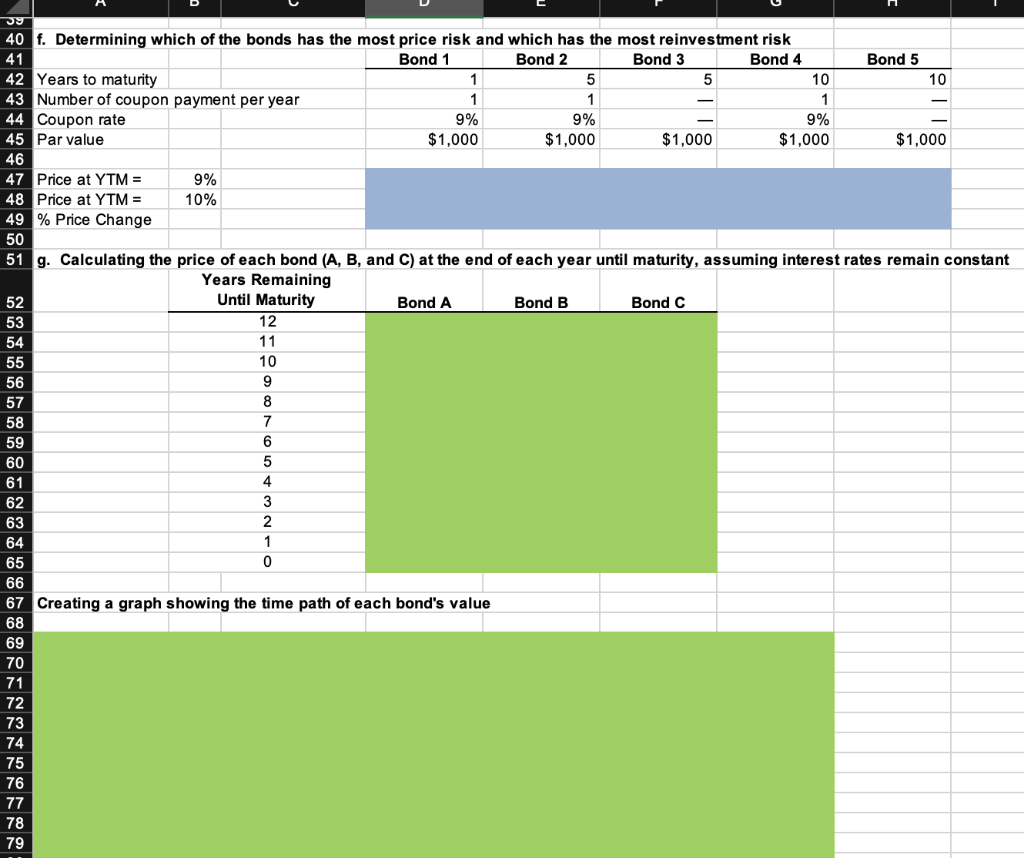
40 f. Determining which of the bonds has the most price risk and which has the most reinvestment risk begin{tabular}{l|l} hline 41 & hline
Step by Step Solution
There are 3 Steps involved in it
Step: 1

Get Instant Access to Expert-Tailored Solutions
See step-by-step solutions with expert insights and AI powered tools for academic success
Step: 2

Step: 3
Ace Your Homework with AI
Get the answers you need in no time with our AI-driven, step-by-step assistance
Get Started
The Handbook Of The Political Economy Of Financial Crises
Authors: Martin H. Wolfson, Gerald A. Epstein
1st Edition
0199757232, 978-0199757237