

Answered step by step
Verified Expert Solution
Question
1 Approved Answer
4.1 SYSTEM DESCRIPTION Welcome to the Emperor palace! The elder daughter of Probabil the Great, beautiful Princess Variance, reached the 2-pi-square age that is considered
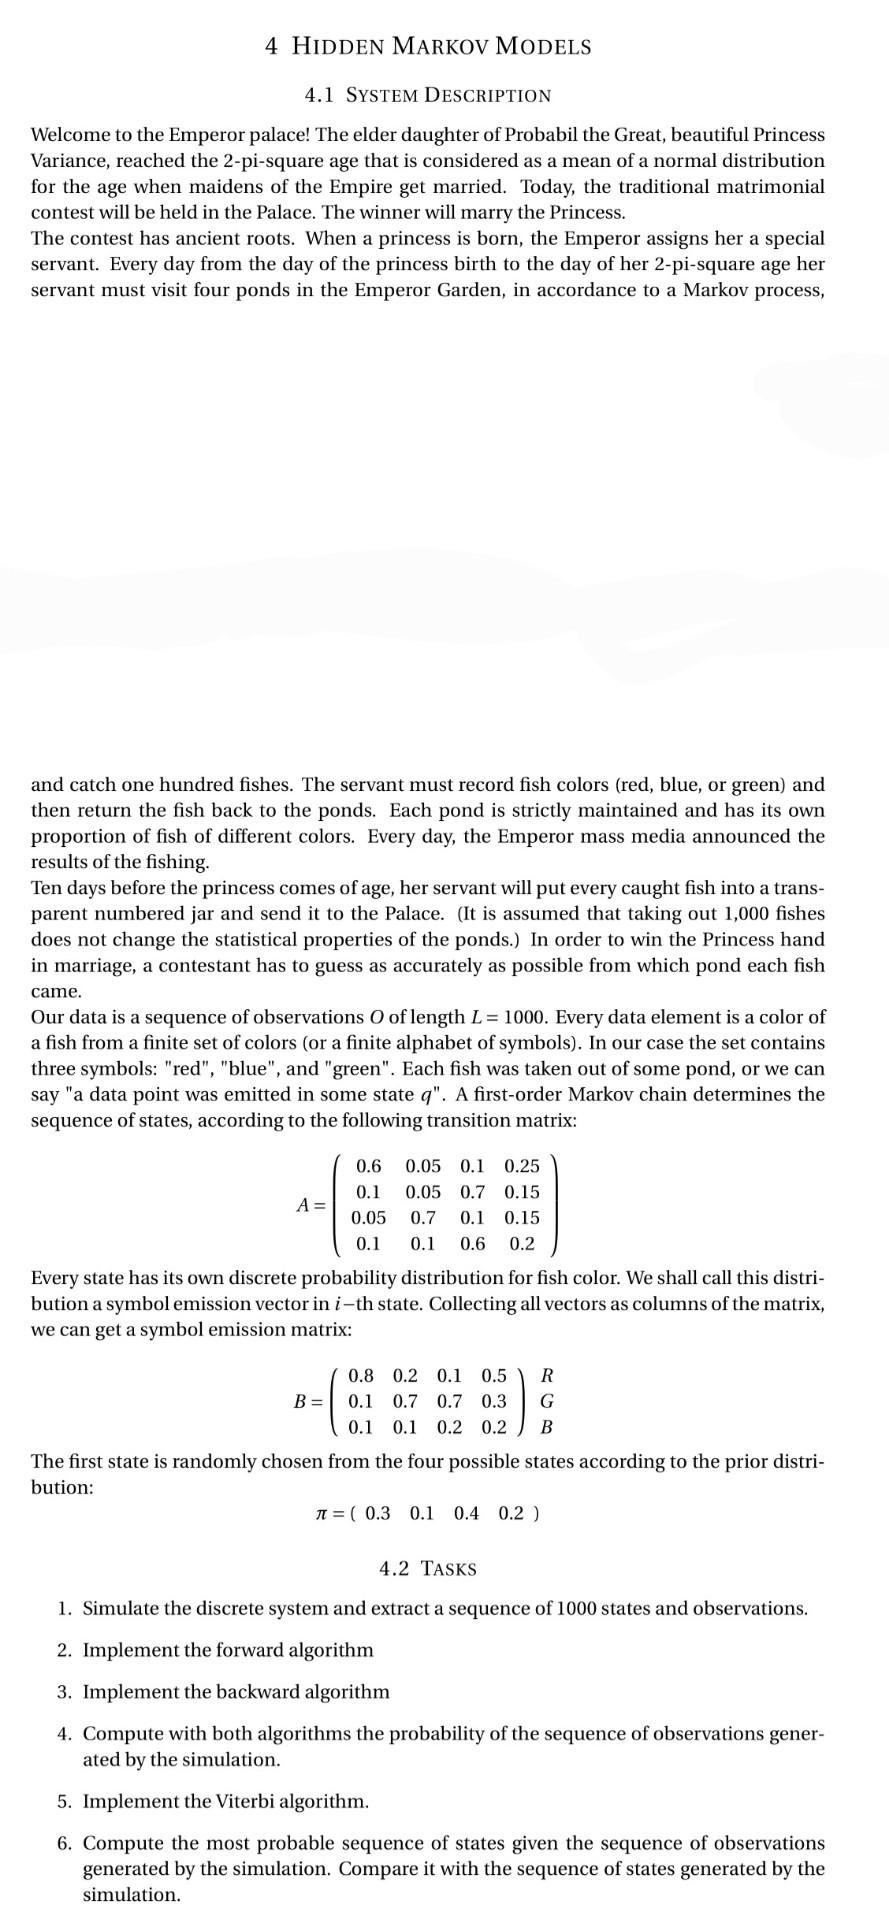
4.1 SYSTEM DESCRIPTION Welcome to the Emperor palace! The elder daughter of Probabil the Great, beautiful Princess Variance, reached the 2-pi-square age that is considered as a mean of a normal distribution for the age when maidens of the Empire get married. Today, the traditional matrimonial contest will be held in the Palace. The winner will marry the Princess. The contest has ancient roots. When a princess is born, the Emperor assigns her a special servant. Every day from the day of the princess birth to the day of her 2-pi-square age her servant must visit four ponds in the Emperor Garden, in accordance to a Markov process, and catch one hundred fishes. The servant must record fish colors (red, blue, or green) and then return the fish back to the ponds. Each pond is strictly maintained and has its own proportion of fish of different colors. Every day, the Emperor mass media announced the results of the fishing. Ten days before the princess comes of age, her servant will put every caught fish into a transparent numbered jar and send it to the Palace. (It is assumed that taking out 1,000 fishes does not change the statistical properties of the ponds.) In order to win the Princess hand in marriage, a contestant has to guess as accurately as possible from which pond each fish came. Our data is a sequence of observations O of length L=1000. Every data element is a color of a fish from a finite set of colors (or a finite alphabet of symbols). In our case the set contains three symbols: "red", "blue", and "green". Each fish was taken out of some pond, or we can say "a data point was emitted in some state q ". A first-order Markov chain determines the sequence of states, according to the following transition matrix: A=0.60.10.050.10.050.050.70.10.10.70.10.60.250.150.150.2 Every state has its own discrete probability distribution for fish color. We shall call this distribution a symbol emission vector in i th state. Collecting all vectors as columns of the matrix, we can get a symbol emission matrix: B=0.80.10.10.20.70.10.10.70.20.50.30.2RG The first state is randomly chosen from the four possible states according to the prior distribution: =(0.30.10.40.2) 4.2 TASKS 1. Simulate the discrete system and extract a sequence of 1000 states and observations. 2. Implement the forward algorithm 3. Implement the backward algorithm 4. Compute with both algorithms the probability of the sequence of observations generated by the simulation. 5. Implement the Viterbi algorithm. 6. Compute the most probable sequence of states given the sequence of observations generated by the simulation. Compare it with the sequence of states generated by the simulation
Step by Step Solution
There are 3 Steps involved in it
Step: 1

Get Instant Access with AI-Powered Solutions
See step-by-step solutions with expert insights and AI powered tools for academic success
Step: 2

Step: 3
Ace Your Homework with AI
Get the answers you need in no time with our AI-driven, step-by-step assistance
Get Started