

Answered step by step
Verified Expert Solution
Question
1 Approved Answer
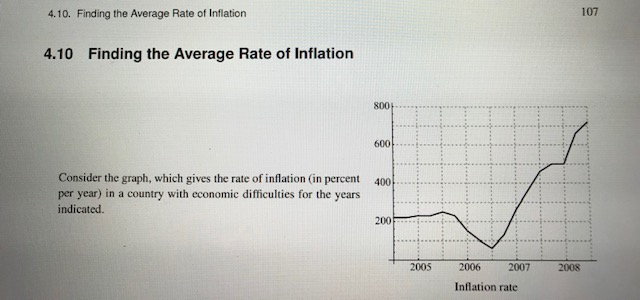
4.10. Finding the Average Rate of Inflation 107 4.10 Finding the Average Rate of Inflation 00wwwww Consider the graph, which gives the rate of inflation
Step by Step Solution
There are 3 Steps involved in it
Step: 1

Get Instant Access to Expert-Tailored Solutions
See step-by-step solutions with expert insights and AI powered tools for academic success
Step: 2

Step: 3
Ace Your Homework with AI
Get the answers you need in no time with our AI-driven, step-by-step assistance
Get Started
Role Of The Commissioner In Audit Findings Of A National Survey Of Commissioning Authorities In England Evaluating Medical Audit
Authors: Moira, Rumsey
1st Edition
1898845026, 978-1898845027