

Answered step by step
Verified Expert Solution
Question
1 Approved Answer
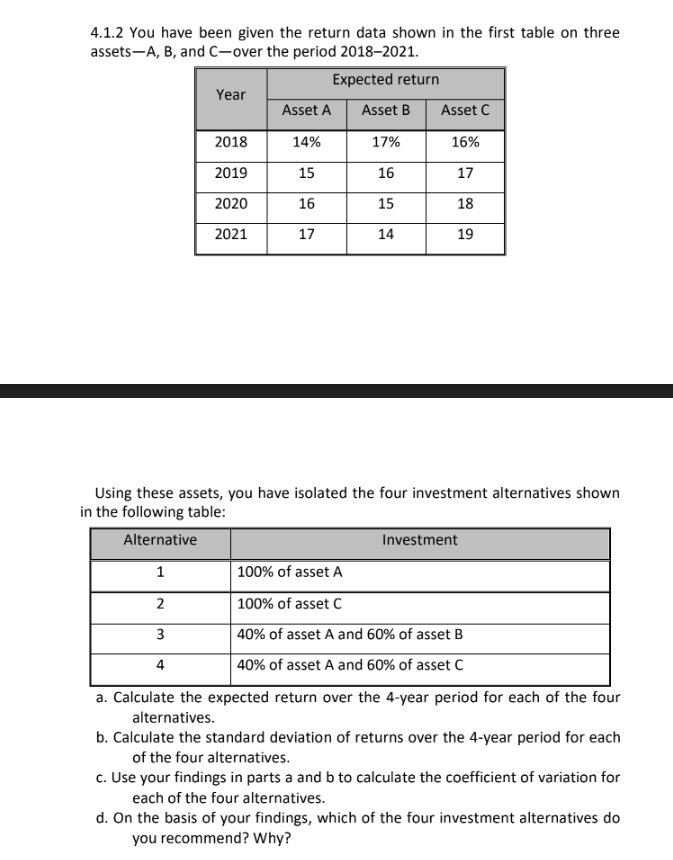
4.1.2 You have been given the return data shown in the first table on three assets-A, B, and C-over the period 2018-2021. Expected return Year
Step by Step Solution
There are 3 Steps involved in it
Step: 1

Get Instant Access to Expert-Tailored Solutions
See step-by-step solutions with expert insights and AI powered tools for academic success
Step: 2

Step: 3
Ace Your Homework with AI
Get the answers you need in no time with our AI-driven, step-by-step assistance
Get Started
Multicriteria Decision Making Systems Modeling Risk Assessment And Financial Analysis For Technical Projects
Authors: Timothy Havranek, Doug MacNair, James Wolf
3110765640, 978-3110765649