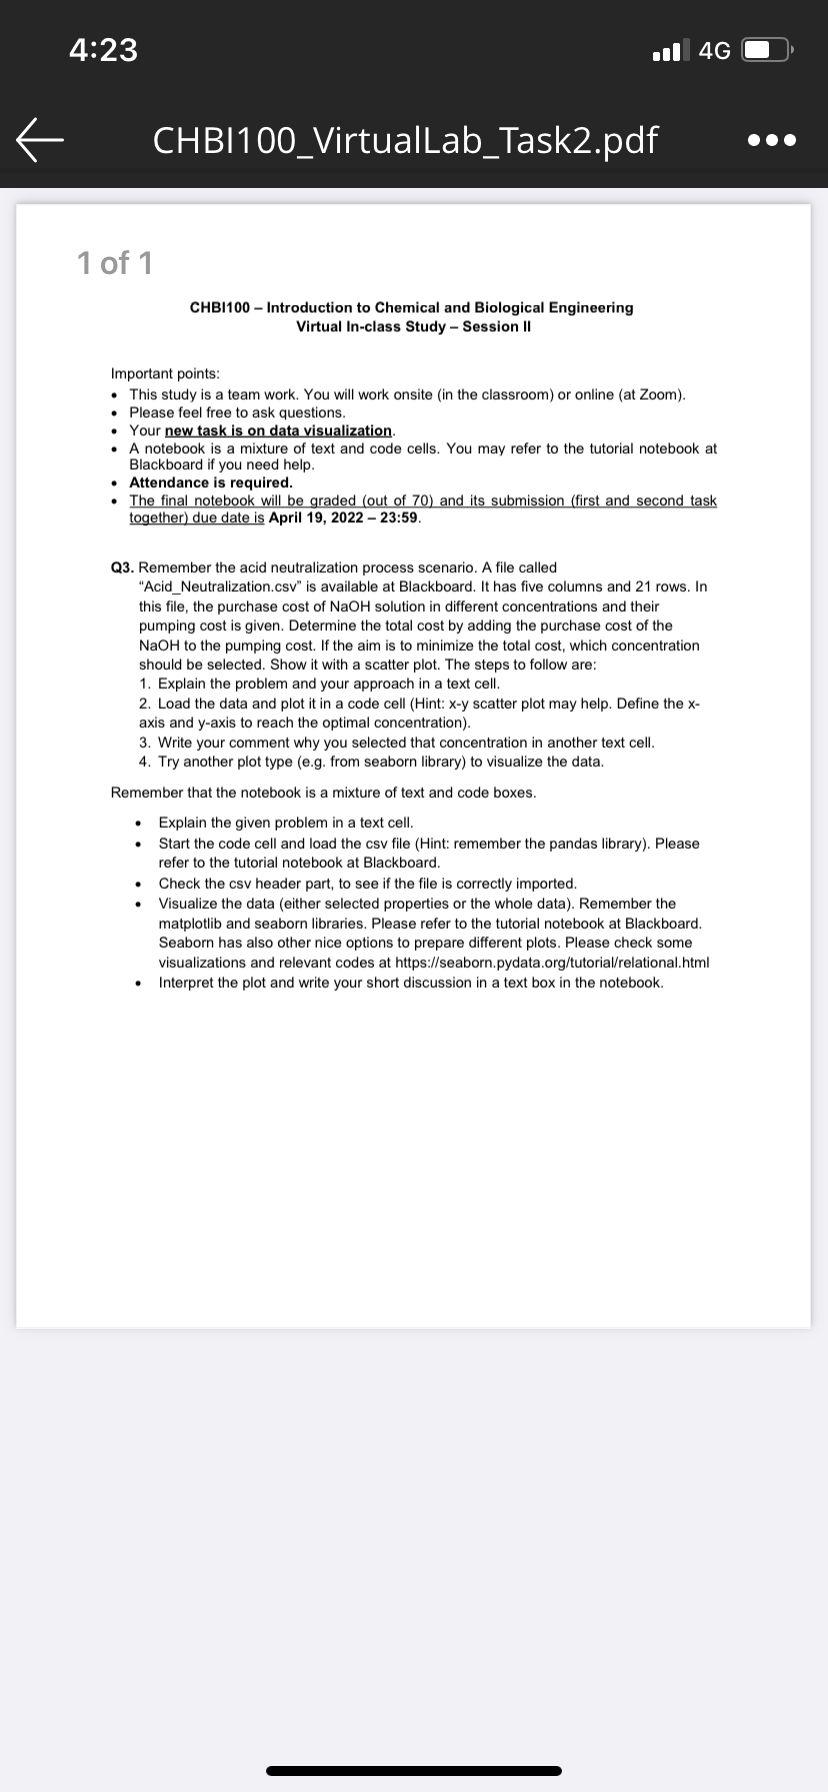
4:23 ul 4G CHBI100_VirtualLab_Task2.pdf ... 1 of 1 CHBI100 - Introduction to Chemical and Biological Engineering Virtual In-class Study - Session II Important points: This study is a team work. You will work onsite (in the classroom) or online (at Zoom). Please feel free to ask questions. Your new task is on data visualization. A notebook is a mixture of text and code cells. You may refer to the tutorial notebook at Blackboard if you need help. Attendance is required. The final notebook will be graded (out of 70) and its submission (first and second task together) due date is April 19, 2022 - 23:59. Q3. Remember the acid neutralization process scenario. A file called "Acid_Neutralization.csv" is available at Blackboard. It has five columns and 21 rows. In this file, the purchase cost of NaOH solution in different concentrations and their pumping cost is given. Determine the total cost by adding the purchase cost of the NaOH to the pumping cost. If the aim is to minimize the total cost, which concentration should be selected. Show it with a scatter plot. The steps to follow are: 1. Explain the problem and your approach in a text cell. 2. Load the data and plot it in a code cell (Hint: x-y scatter plot may help. Define the x- axis and y-axis to reach the optimal concentration). 3. Write your comment why you selected that concentration in another text cell. 4. Try another plot type (e.g. from seaborn library) to visualize the data. Remember that the notebook is a mixture of text and code boxes. Explain the given problem in a text cell. Start the code cell and load the csv file (Hint: remember the pandas library). Please refer to the tutorial notebook at Blackboard. Check the csv header part, to see if the file is correctly imported. Visualize the data (either selected properties or the whole data). Remember the matplotlib and seaborn libraries. Please refer to the tutorial notebook at Blackboard. Seaborn has also other nice options to prepare different plots. Please check some visualizations and relevant codes at https://seaborn.pydata.org/tutorial/relational.html Interpret the plot and write your short discussion in a text box in the notebook . 4:23 ul 4G CHBI100_VirtualLab_Task2.pdf ... 1 of 1 CHBI100 - Introduction to Chemical and Biological Engineering Virtual In-class Study - Session II Important points: This study is a team work. You will work onsite (in the classroom) or online (at Zoom). Please feel free to ask questions. Your new task is on data visualization. A notebook is a mixture of text and code cells. You may refer to the tutorial notebook at Blackboard if you need help. Attendance is required. The final notebook will be graded (out of 70) and its submission (first and second task together) due date is April 19, 2022 - 23:59. Q3. Remember the acid neutralization process scenario. A file called "Acid_Neutralization.csv" is available at Blackboard. It has five columns and 21 rows. In this file, the purchase cost of NaOH solution in different concentrations and their pumping cost is given. Determine the total cost by adding the purchase cost of the NaOH to the pumping cost. If the aim is to minimize the total cost, which concentration should be selected. Show it with a scatter plot. The steps to follow are: 1. Explain the problem and your approach in a text cell. 2. Load the data and plot it in a code cell (Hint: x-y scatter plot may help. Define the x- axis and y-axis to reach the optimal concentration). 3. Write your comment why you selected that concentration in another text cell. 4. Try another plot type (e.g. from seaborn library) to visualize the data. Remember that the notebook is a mixture of text and code boxes. Explain the given problem in a text cell. Start the code cell and load the csv file (Hint: remember the pandas library). Please refer to the tutorial notebook at Blackboard. Check the csv header part, to see if the file is correctly imported. Visualize the data (either selected properties or the whole data). Remember the matplotlib and seaborn libraries. Please refer to the tutorial notebook at Blackboard. Seaborn has also other nice options to prepare different plots. Please check some visualizations and relevant codes at https://seaborn.pydata.org/tutorial/relational.html Interpret the plot and write your short discussion in a text box in the notebook


