

Question
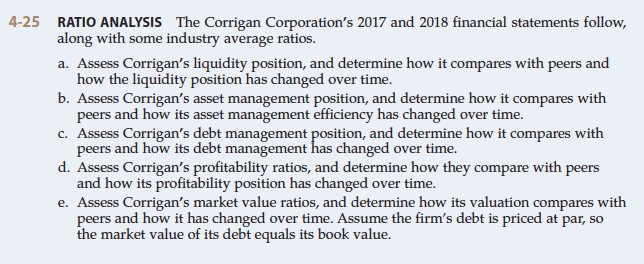
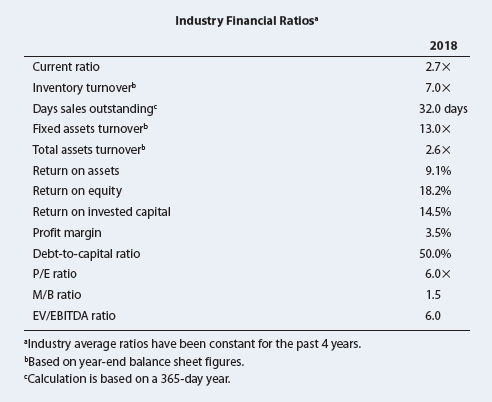
4-25 RATIO ANALYSIS The Corrigan Corporations 2017 and 2018 financial statements follow, along with some industry average ratios. a. Assess Corrigans liquidity position, and determine
4-25 RATIO ANALYSIS The Corrigan Corporations 2017 and 2018 financial statements follow,
along with some industry average ratios.
a. Assess Corrigans liquidity position, and determine how it compares with peers and
how the liquidity position has changed over time.
b. Assess Corrigans asset management position, and determine how it compares with
peers and how its asset management efficiency has changed over time.
c. Assess Corrigans debt management position, and determine how it compares with
peers and how its debt management has changed over time.
d. Assess Corrigans profitability ratios, and determine how they compare with peers
and how its profitability position has changed over time.
e. Assess Corrigans market value ratios, and determine how its valuation compares with
peers and how it has changed over time. Assume the firms debt is priced at par, so
the market value of its debt equals its book value
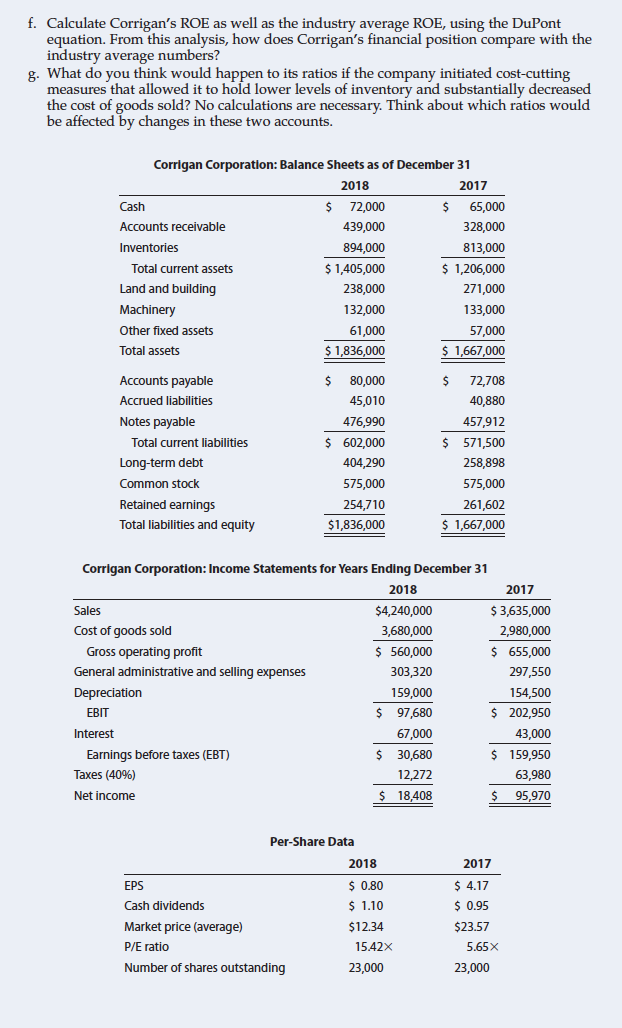
f. Calculate Corrigans ROE as well as the industry average ROE, using the DuPont
equation. From this analysis, how does Corrigans financial position compare with the
industry average numbers?
g. What do you think would happen to its ratios if the company initiated cost-cutting
measures that allowed it to hold lower levels of inventory and substantially decreased
the cost of goods sold? No calculations are necessary. Think about which ratios would
be affected by changes in these two accounts.
Step by Step Solution
There are 3 Steps involved in it
Step: 1

Get Instant Access to Expert-Tailored Solutions
See step-by-step solutions with expert insights and AI powered tools for academic success
Step: 2

Step: 3
Ace Your Homework with AI
Get the answers you need in no time with our AI-driven, step-by-step assistance
Get Started
Fearless Finances A Timeless Guide To Building Wealth
Authors: Cassandra Cummings
1st Edition
1400230381, 978-1400230389