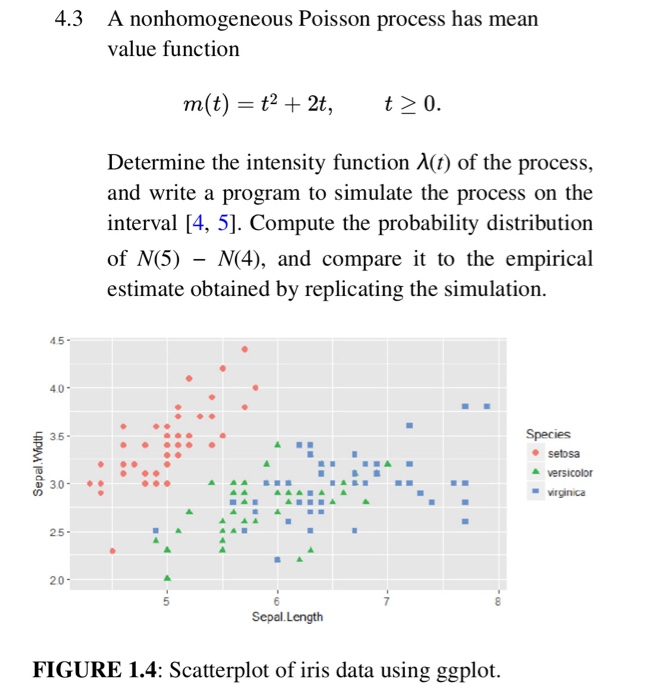
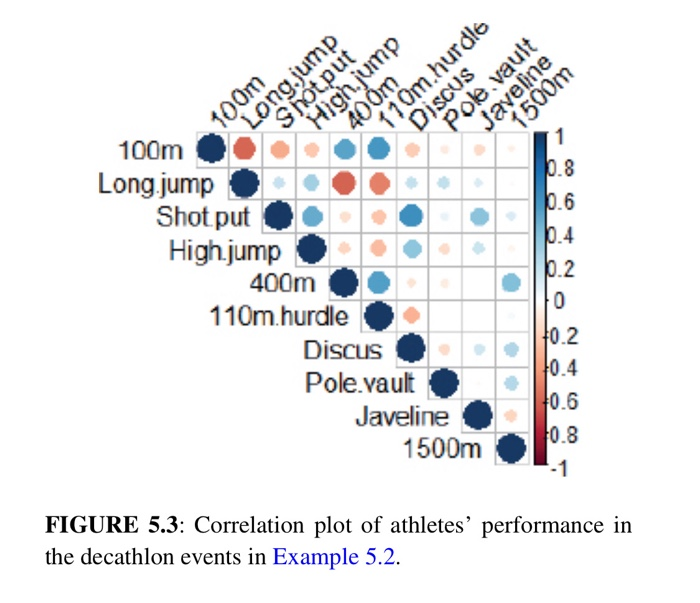
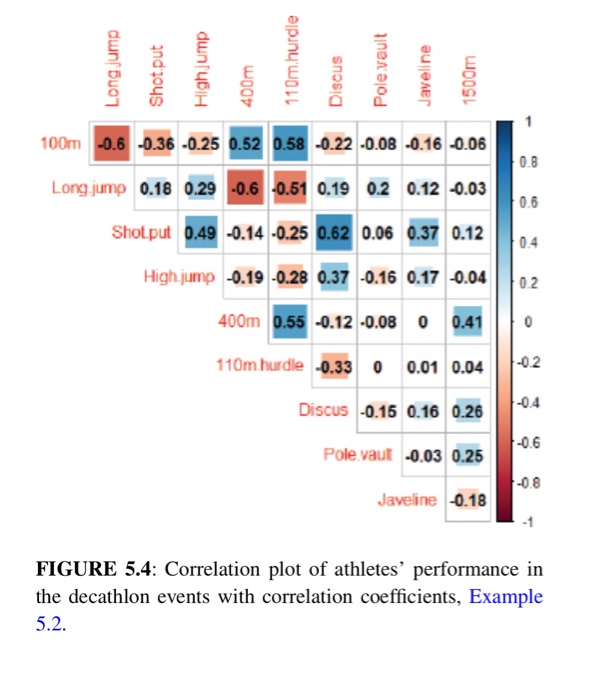
4.3 A nonhomogeneous Poisson process has mean value function m(t) = t2 + 2t, t> 0. Determine the intensity function 1(t) of the process, and write a program to simulate the process on the interval [4, 5]. Compute the probability distribution of N(5) - N(4), and compare it to the empirical estimate obtained by replicating the simulation. 4.5 - Sepal Width Species setosa A versicolor virginica 20- Sepal.Length FIGURE 1.4: Scatterplot of iris data using ggplot. Long.jump 11 Om hurdle Javeline 1500m 100m Shot put High.jump 400m DISCUS Pole vault 1 100m Long.jump Shot put High jump 400m 00 110m.hurdle Discus Pole vault Javeline 1500m HO 1 +0.2 110.4 0.6 FIGURE 5.3: Correlation plot of athletes' performance in the decathlon events in Example 5.2. Long Jump Shot.put High jump 110mhurdle Discus Pole vault 400m Pole vault Javeline S 100m -0.6 -0.36 -0.25 Long jump 0.18 0.29 -0.6 Shot put 0.49 -0.14 -0.25 0.62 High jump -0.19 -0.28 0.37 -0.16 400m 0.55 -0.12 -0.08 110m.hurdle -0.33 0 0.01 Discus -0.15 0.16 0.26 Pole vaut -0.03 0.25 Javeline -0.18 FIGURE 5.4: Correlation plot of athletes' performance in the decathlon events with correlation coefficients, Example 5.2. 4.3 A nonhomogeneous Poisson process has mean value function m(t) = t2 + 2t, t> 0. Determine the intensity function 1(t) of the process, and write a program to simulate the process on the interval [4, 5]. Compute the probability distribution of N(5) - N(4), and compare it to the empirical estimate obtained by replicating the simulation. 4.5 - Sepal Width Species setosa A versicolor virginica 20- Sepal.Length FIGURE 1.4: Scatterplot of iris data using ggplot. Long.jump 11 Om hurdle Javeline 1500m 100m Shot put High.jump 400m DISCUS Pole vault 1 100m Long.jump Shot put High jump 400m 00 110m.hurdle Discus Pole vault Javeline 1500m HO 1 +0.2 110.4 0.6 FIGURE 5.3: Correlation plot of athletes' performance in the decathlon events in Example 5.2. Long Jump Shot.put High jump 110mhurdle Discus Pole vault 400m Pole vault Javeline S 100m -0.6 -0.36 -0.25 Long jump 0.18 0.29 -0.6 Shot put 0.49 -0.14 -0.25 0.62 High jump -0.19 -0.28 0.37 -0.16 400m 0.55 -0.12 -0.08 110m.hurdle -0.33 0 0.01 Discus -0.15 0.16 0.26 Pole vaut -0.03 0.25 Javeline -0.18 FIGURE 5.4: Correlation plot of athletes' performance in the decathlon events with correlation coefficients, Example 5.2


