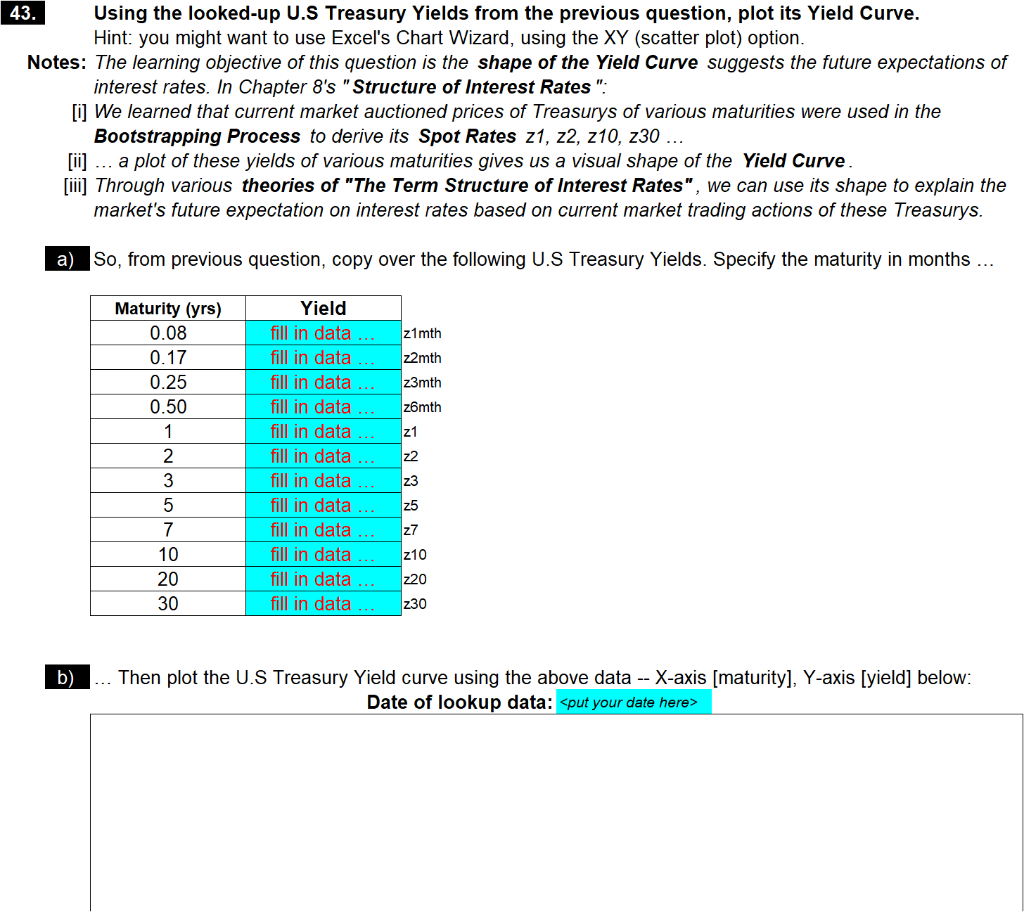
43. Using the looked-up U.S Treasury Yields from the previous question, plot its Yield Curve. Hint: you might want to use Excel's Chart Wizard, using the XY (scatter plot) option. Notes: The learning objective of this question is the shape of the Yield Curve suggests the future expectations of interest rates. In Chapter 8's "Structure of Interest Rates": [i] We learned that current market auctioned prices of Treasurys of various maturities were used in the Bootstrapping Process to derive its Spot Rates z1, z2, z10, 230 ... [ii] ... a plot of these yields of various maturities gives us a visual shape of the Yield Curve. [iii] Through various theories of "The Term Structure of Interest Rates", we can use its shape to explain the market's future expectation on interest rates based on current market trading actions of these Treasurys. a) So, from previous question, copy over the following U.S Treasury Yields. Specify the maturity in months ... z1mth z2mth z3mth z6mth Maturity (yrs) 0.08 0.17 0.25 0.50 1 2 3 5 7 10 20 30 Yield fill in data fill in data fill in data ... fill in data fill in data .... fill in data ... fill in data ... fill in data ... fill in data fill in data ... fill in data ... fill in data z1 z2 z3 z5 z7 z10 220 230 b) Then plot the U.S Treasury Yield curve using the above data -- X-axis [maturity], Y-axis [yield] below: Date of lookup data:
43. Using the looked-up U.S Treasury Yields from the previous question, plot its Yield Curve. Hint: you might want to use Excel's Chart Wizard, using the XY (scatter plot) option. Notes: The learning objective of this question is the shape of the Yield Curve suggests the future expectations of interest rates. In Chapter 8's "Structure of Interest Rates": [i] We learned that current market auctioned prices of Treasurys of various maturities were used in the Bootstrapping Process to derive its Spot Rates z1, z2, z10, 230 ... [ii] ... a plot of these yields of various maturities gives us a visual shape of the Yield Curve. [iii] Through various theories of "The Term Structure of Interest Rates", we can use its shape to explain the market's future expectation on interest rates based on current market trading actions of these Treasurys. a) So, from previous question, copy over the following U.S Treasury Yields. Specify the maturity in months ... z1mth z2mth z3mth z6mth Maturity (yrs) 0.08 0.17 0.25 0.50 1 2 3 5 7 10 20 30 Yield fill in data fill in data fill in data ... fill in data fill in data .... fill in data ... fill in data ... fill in data ... fill in data fill in data ... fill in data ... fill in data z1 z2 z3 z5 z7 z10 220 230 b) Then plot the U.S Treasury Yield curve using the above data -- X-axis [maturity], Y-axis [yield] below: Date of lookup data: