

Question: 4:38 10:29 4G: all| 75% bio N6...x1-1 . . . PART II. (25%) Using the N6208 Final Project Data, ( Use the SPSS tables below
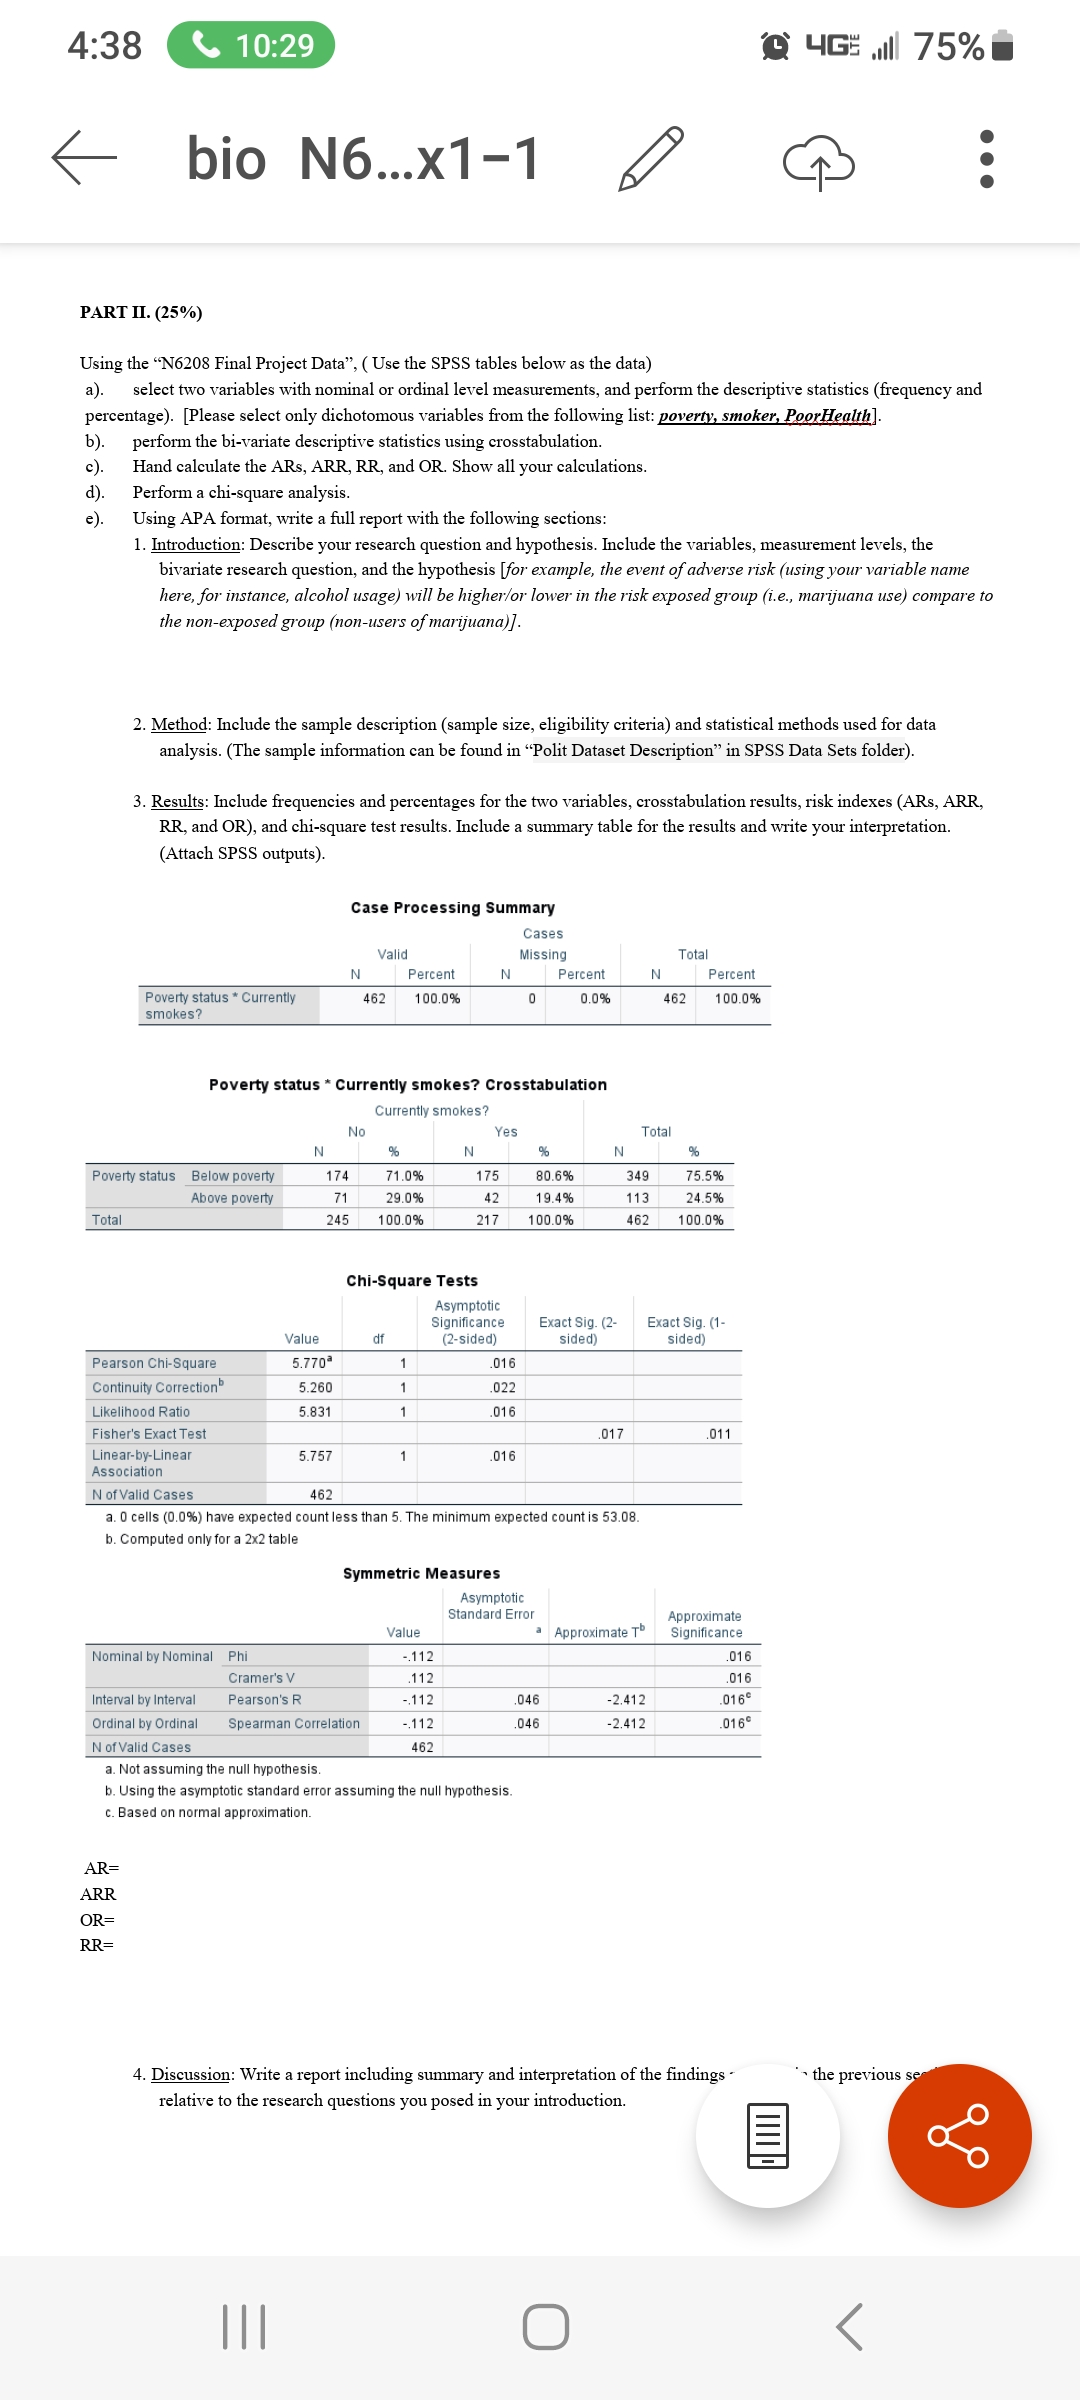
4:38 10:29 4G: all| 75% bio N6...x1-1 . . . PART II. (25%) Using the "N6208 Final Project Data", ( Use the SPSS tables below as the data) a). select two variables with nominal or ordinal level measurements, and perform the descriptive statistics (frequency and percentage). [Please select only dichotomous variables from the following list: poverty, smoker, PoorHealth]. b ) . perform the bi-variate descriptive statistics using crosstabulation. Hand calculate the ARs, ARR, RR, and OR. Show all your calculations. d). Perform a chi-square analysis. e). Using APA format, write a full report with the following sections: 1. Introduction: Describe your research question and hypothesis. Include the variables, measurement levels, the bivariate research question, and the hypothesis [for example, the event of adverse risk (using your variable name here, for instance, alcohol usage) will be higher/or lower in the risk exposed group (i.e., marijuana use) compare to the non-exposed group (non-users of marijuana)]. 2. Method: Include the sample description (sample size, eligibility criteria) and statistical methods used for data analysis. (The sample information can be found in "Polit Dataset Description" in SPSS Data Sets folder). 3. Results: Include frequencies and percentages for the two variables, crosstabulation results, risk indexes (ARs, ARR, RR, and OR), and chi-square test results. Include a summary table for the results and write your interpretation. (Attach SPSS outputs). Case Processing Summary Cases Valid Missing Total N Percent N Percent N Percent Poverty status * Currently 462 100.0% 0.0% 462 100.0% smokes? Poverty status * Currently smokes? Crosstabulation Currently smokes? NO Yes Total N Poverty status Below poverty 174 71.0% 175 80.6% 349 75.5% Above poverty 71 29.09 42 19.4% 113 24.59% Total 245 100.0% 217 100.0% 462 100.0% Chi-Square Tests Asymptotic Significance Exact Sig. (2- Exact Sig. (1- Value df (2-sided) sided) sided) Pearson Chi-Square 5.770 016 Continuity Correction 5.260 022 Likelihood Ratio 5.831 016 Fisher's Exact Test 017 011 Linear-by-Linear 5.757 016 Association N of Valid Cases 462 a. 0 cells (0.0%) have expected count less than 5. The minimum expected count is 53.08. b. Computed only for a 2x2 table Symmetric Measures Asymptotic Standard Error Approximate Value Approximate To Significance Nominal by Nominal Phi -.112 016 Cramer's V .112 . 016 Interval by Interval Pearson's R -.112 .046 -2.412 016 Ordinal by Ordinal Spearman Correlation -.112 .046 -2.412 016 N of Valid Cases 462 a. Not assuming the null hypothesis b. Using the asymptotic standard error assuming the null hypothesis. c. Based on normal approximation. AR= ARR OR RR= 4. Discussion: Write a report including summary and interpretation of the findings .. the previous se relative to the research questions you posed in your introduction. I IIII O
Step by Step Solution
There are 3 Steps involved in it

Get step-by-step solutions from verified subject matter experts