

Answered step by step
Verified Expert Solution
Question
1 Approved Answer
44% *Analyzing Financial Risk and Return Investors (and shareholders), optimally diversify to minimize risk for any level of expected returns. They often do so
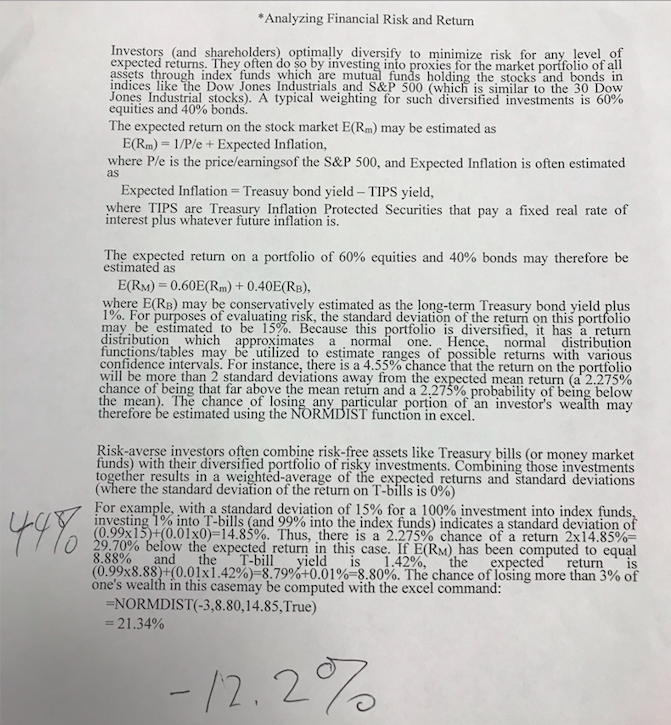
44% *Analyzing Financial Risk and Return Investors (and shareholders), optimally diversify to minimize risk for any level of expected returns. They often do so by investing into proxies for the market portfolio of all assets through index funds which are mutual funds holding the stocks and bonds in indices like the Dow Jones Industrials, and S&P 500 (which is similar to the 30 Dow Jones Industrial stocks). A typical weighting for such diversified investments is 60% equities and 40% bonds. The expected return on the stock market E(Rm) may be estimated as E(Rm) 1/P/e+Expected Inflation, where P/e is the price/earningsof the S&P 500, and Expected Inflation is often estimated as = Expected Inflation Treasuy bond yield - TIPS yield, where TIPS are Treasury Inflation Protected Securities that pay a fixed real rate of interest plus whatever future inflation is. The expected return on a portfolio of 60% equities and 40% bonds may therefore be estimated as E(RM) 0.60E(Rm) + 0.40E(RB), where E(RB) may be conservatively estimated as the long-term Treasury bond yield plus 1%. For purposes of evaluating risk, the standard deviation of the return on this portfolio may be estimated to be 15%. Because this portfolio is diversified, it has a return distribution which approximates a normal one. Hence, normal distribution functions/tables may be utilized to estimate ranges of possible returns with various confidence intervals. For instance, there is a 4.55% chance that the return on the portfolio will be more than 2 standard deviations away from the expected mean return (a 2.275% chance of being that far above the mean return and a 2.275% probability of being below the mean). The chance of losing any particular portion of an investor's wealth may therefore be estimated using the NORMDIST function in excel. Risk-averse investors often combine risk-free assets like Treasury bills (or money market funds) with their diversified portfolio of risky investments. Combining those investments together results in a weighted-average of the expected returns and standard deviations (where the standard deviation of the return on T-bills is 0%) For example, with a standard deviation of 15% for a 100% investment into index funds, investing 1% into T-bills (and 99% into the index funds) indicates a standard deviation of (0.99x15)+(0.01x0)=-14.85%. Thus, there is a 2.275% chance of a return 2x14.85%- 29.70% below the expected return in this case. If E(RM) has been computed to equal 8.88% and the T-bill yield is 1.42%, the expected return is (0.99x8.88)+(0.01x1.42%)-8.79%+0.01% 8.80%. The chance of losing more than 3% of one's wealth in this casemay be computed with the excel command: =NORMDIST(-3,8.80,14.85,True) = 21.34% -12.2%
Step by Step Solution
There are 3 Steps involved in it
Step: 1

Get Instant Access to Expert-Tailored Solutions
See step-by-step solutions with expert insights and AI powered tools for academic success
Step: 2

Step: 3
Ace Your Homework with AI
Get the answers you need in no time with our AI-driven, step-by-step assistance
Get Started
Business Statistics In Practice
Authors: Bruce Bowerman, Richard O'Connell
6th Edition
0073401838, 978-0073401836