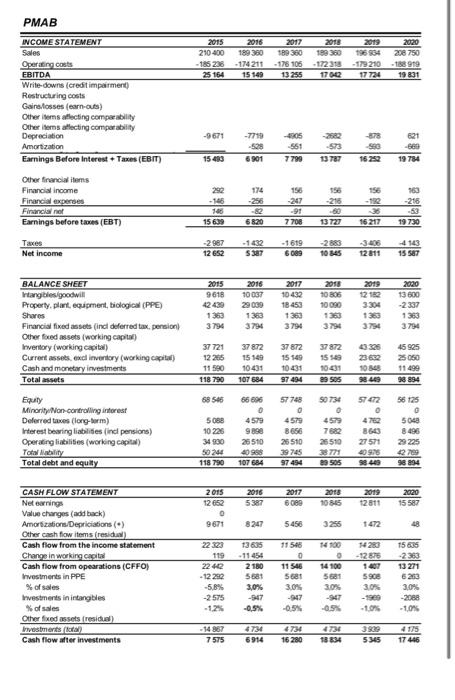
44. Key-ratio 4 2 pong See uploaded PDF in assignment 41. Operating margin. a) 26,3 Ob) 58,0 C 8,8 Od) 9,5 PMAB 2015 210-400 -185 236 25 164 2016 189 300 -174211 15149 2017 189 360 - 178 105 13255 2018 2019 159 360 196994 -172318 -179210 17002 17724 2020 208 750 -188919 19891 INCOME STATEMENT Sales Operating costs EBITDA Write-downs (creditimpairment) Restructuring costs Gaira fosses (carn-outs) Other soms offecting comparability Other items atleting comparability Depreciation Amortization Earnings Before Interest Taxes (EBIT) -9671 -7719 -528 6901 -4805 551 7799 -573 13787 -878 980 16252 621 -660 19734 15453 174 156 Other financial items Financial income Financial expenses Financiare Earnings before taxes (EBT) 156 -216 -216 292 -145 146 15630 156 -247 -91 7708 6820 13727 16 217 19 730 Tues Net income -2987 12 652 - 1432 5387 -1619 6089 -2880 10345 3406 12 811 -4143 15 587 2019 2015 9618 42439 1363 3794 2016 10037 29030 1363 3794 2017 10432 18 453 1363 3794 2015 10806 10 000 3304 2020 13 600 -2337 1363 3794 BALANCE SHEET Intangibles goodwill Property, plant equipment, biologia (PPE) Shares Financial fixed assets (incl deferred tax. pension Other foxed assets (working capital) Inventory (working capital) Current assets, excl inventory (working capital) Cash and monetary investments Total assets 3794 37721 12 265 11 590 118 790 37872 15149 10431 107 684 37872 15 549 10431 97 494 37872 15 59 10031 29 SOS 45 925 23 602 25 050 10348 11499 98 469 98894 58 545 50 734 Equity Minority Non-controlling interest Deferred taxes long-term) Interest bearing liabilities in pensions) Operating liabilities (working capital) Tollability Total debt and equity 5088 10 226 34930 50 240 11870 66 66 0 4579 9898 26510 40 998 107 684 57748 0 4579 8656 26 510 39745 97 494 4579 7682 26510 33771 29 505 57472 0 4762 8643 27571 40925 58 449 56125 0 5048 8496 29 225 4279 98894 2017 2016 5387 2018 10 565 2019 12811 2020 15 587 6080 2015 12 652 0 9671 8247 5456 3255 1472 48 22 23 1365 119 CASH FLOW STATEMENT Netewning Value changes (add back) Amortizations Deprications() Other cash flow items residual Cash flow from the income statement Change in working capital Cash flow from operations (CFFO) Investments in PPE % of sales Investments in intangibles of sales Other fixed assets (residual Investments to Cash flow after investments 2242 -12282 -5.8% -2575 - 12% 2180 5681 3,0% -947 -0.5% 11546 0 11 546 5681 3.0% -947 14100 o 14100 51 30% -12876 1407 590 3.0% 15 635 -2353 13271 6253 3,0% -2088 -10% -0.5 4734 47344 6914 4736 1884 3939 5345 4 175 17 446 7575 16280