

Answered step by step
Verified Expert Solution
Question
1 Approved Answer
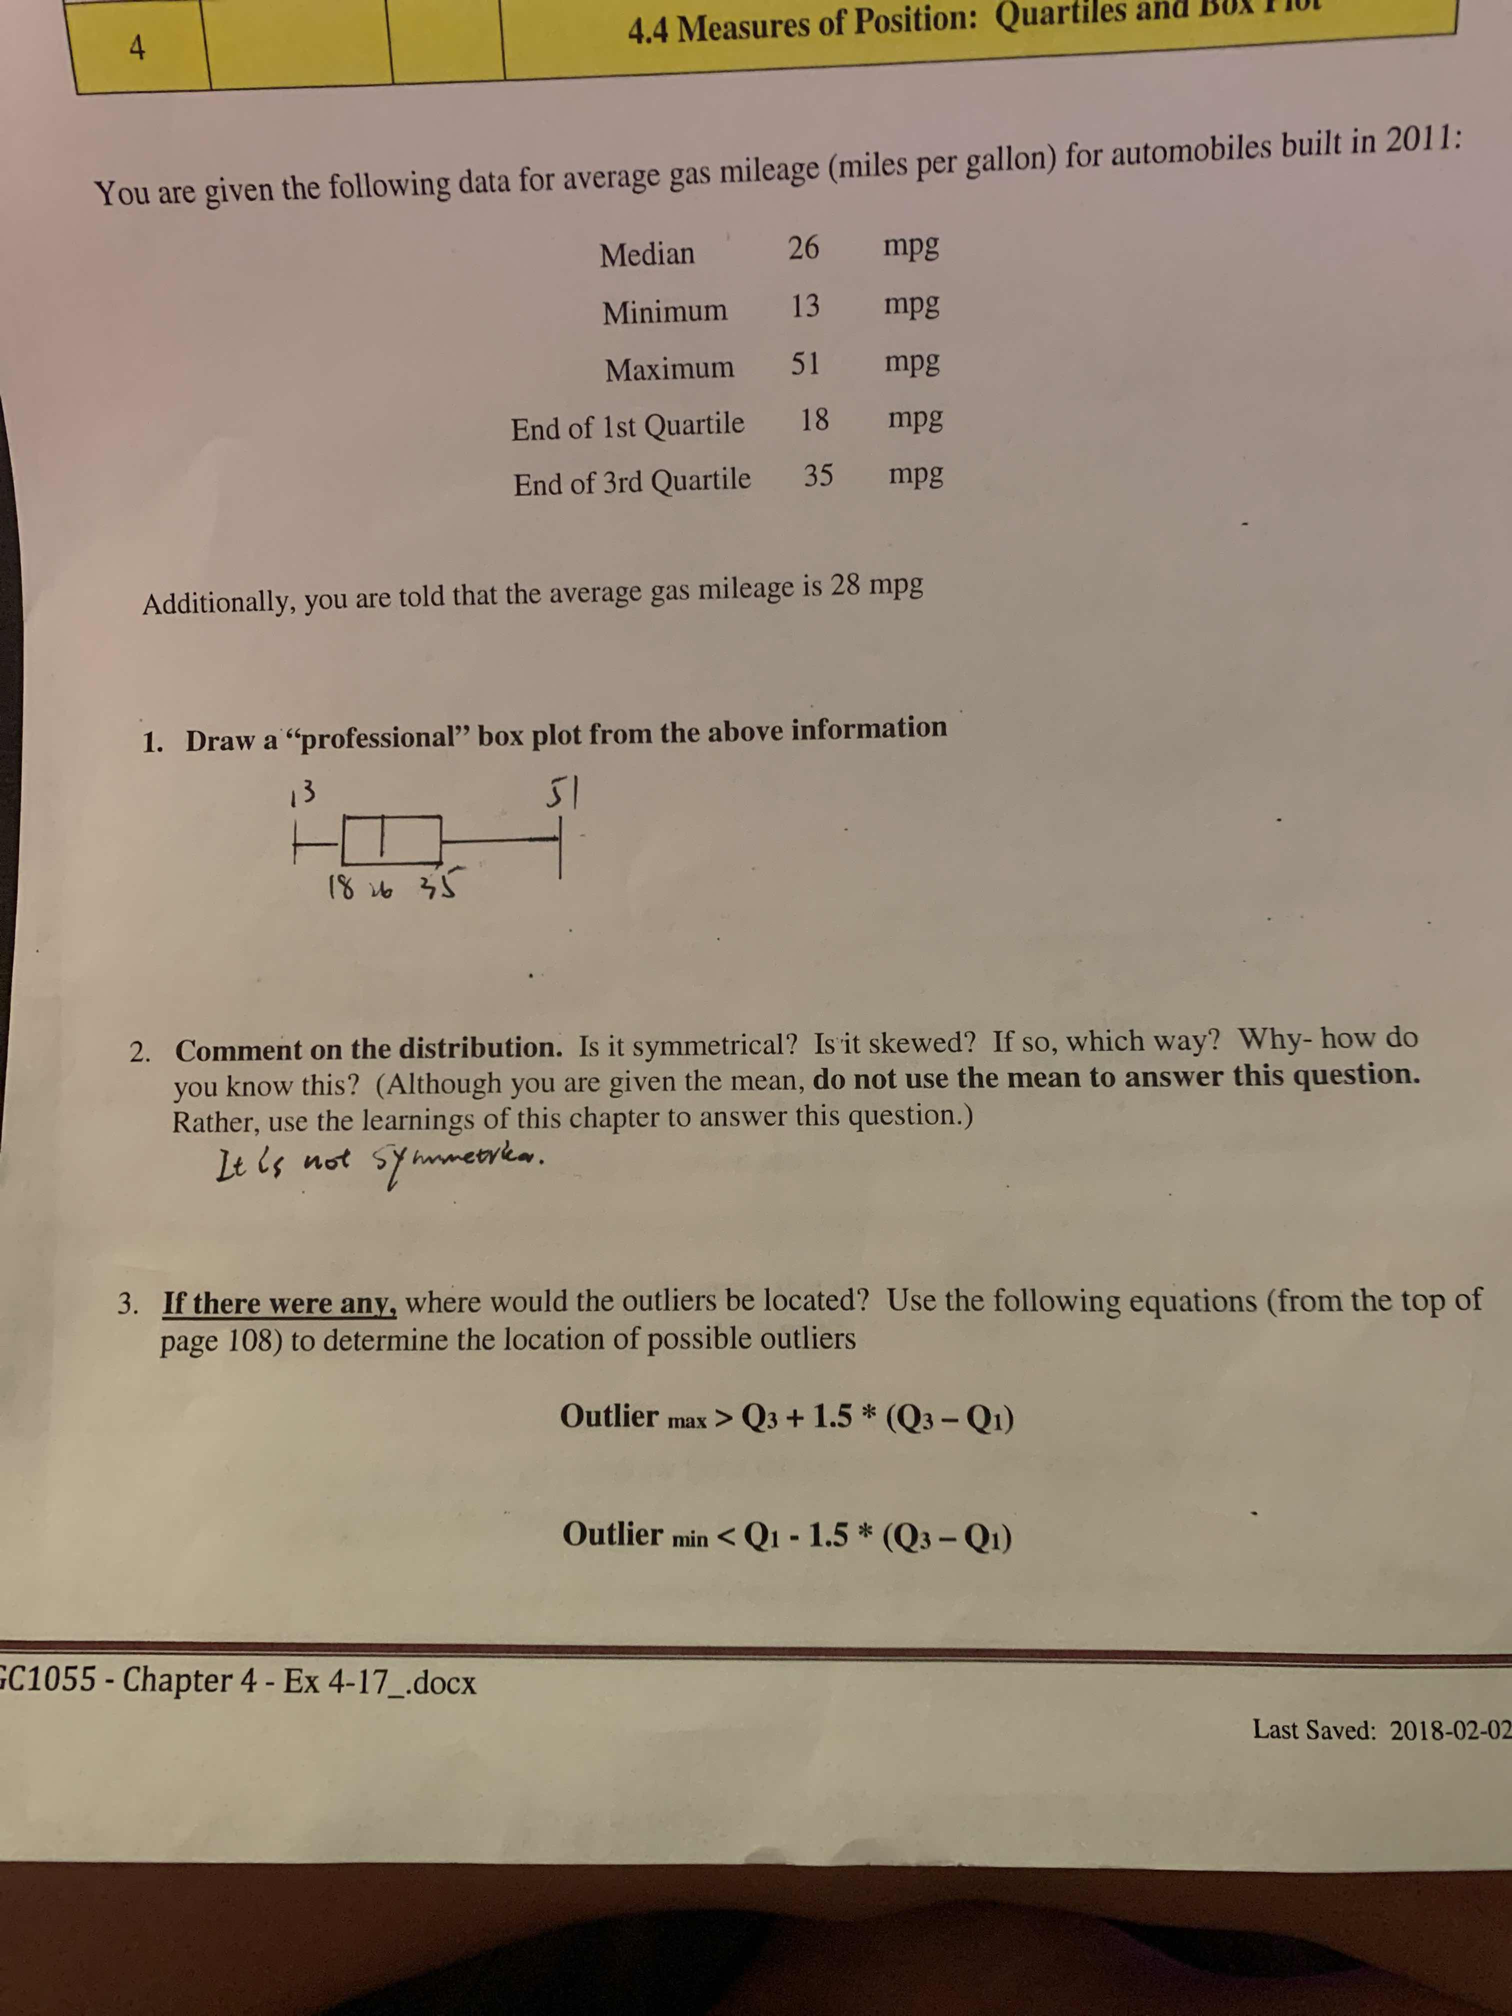
4.4 Measures of Position: Quartiles and DO You are given the following data for average gas mileage (miles per gallon) for automobiles built in 201
Step by Step Solution
There are 3 Steps involved in it
Step: 1

Get Instant Access to Expert-Tailored Solutions
See step-by-step solutions with expert insights and AI powered tools for academic success
Step: 2

Step: 3
Ace Your Homework with AI
Get the answers you need in no time with our AI-driven, step-by-step assistance
Get Started
Elementary Technical Mathematics
Authors: Dale Ewen
12th Edition
1337630586, 978-1337630580