

Answered step by step
Verified Expert Solution
Question
1 Approved Answer
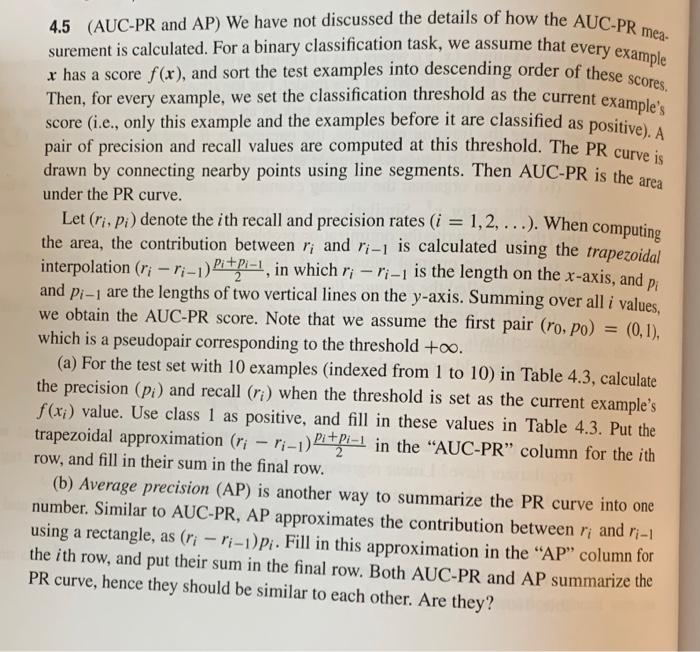
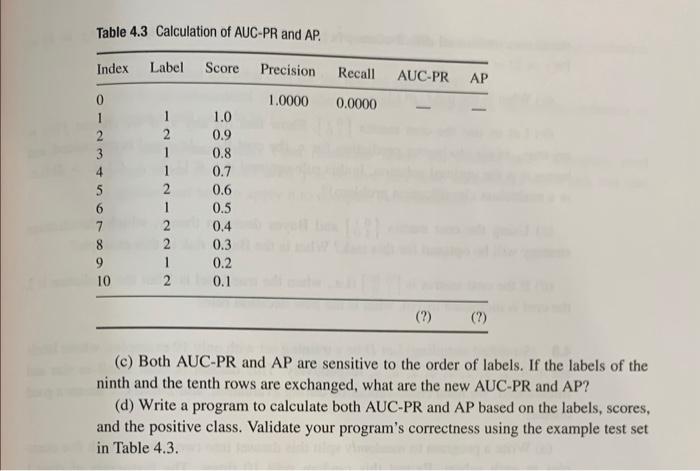
4.5 (AUC-PR and AP) We have not discussed the details of how the AUC-PR mea. surement is calculated. For a binary classification task, we assume
Step by Step Solution
There are 3 Steps involved in it
Step: 1

Get Instant Access to Expert-Tailored Solutions
See step-by-step solutions with expert insights and AI powered tools for academic success
Step: 2

Step: 3
Ace Your Homework with AI
Get the answers you need in no time with our AI-driven, step-by-step assistance
Get Started
Linked Data A Geographic Perspective
Authors: Glen Hart, Catherine Dolbear
1st Edition
1000218910, 9781000218916