Answered step by step
Verified Expert Solution
Question
1 Approved Answer
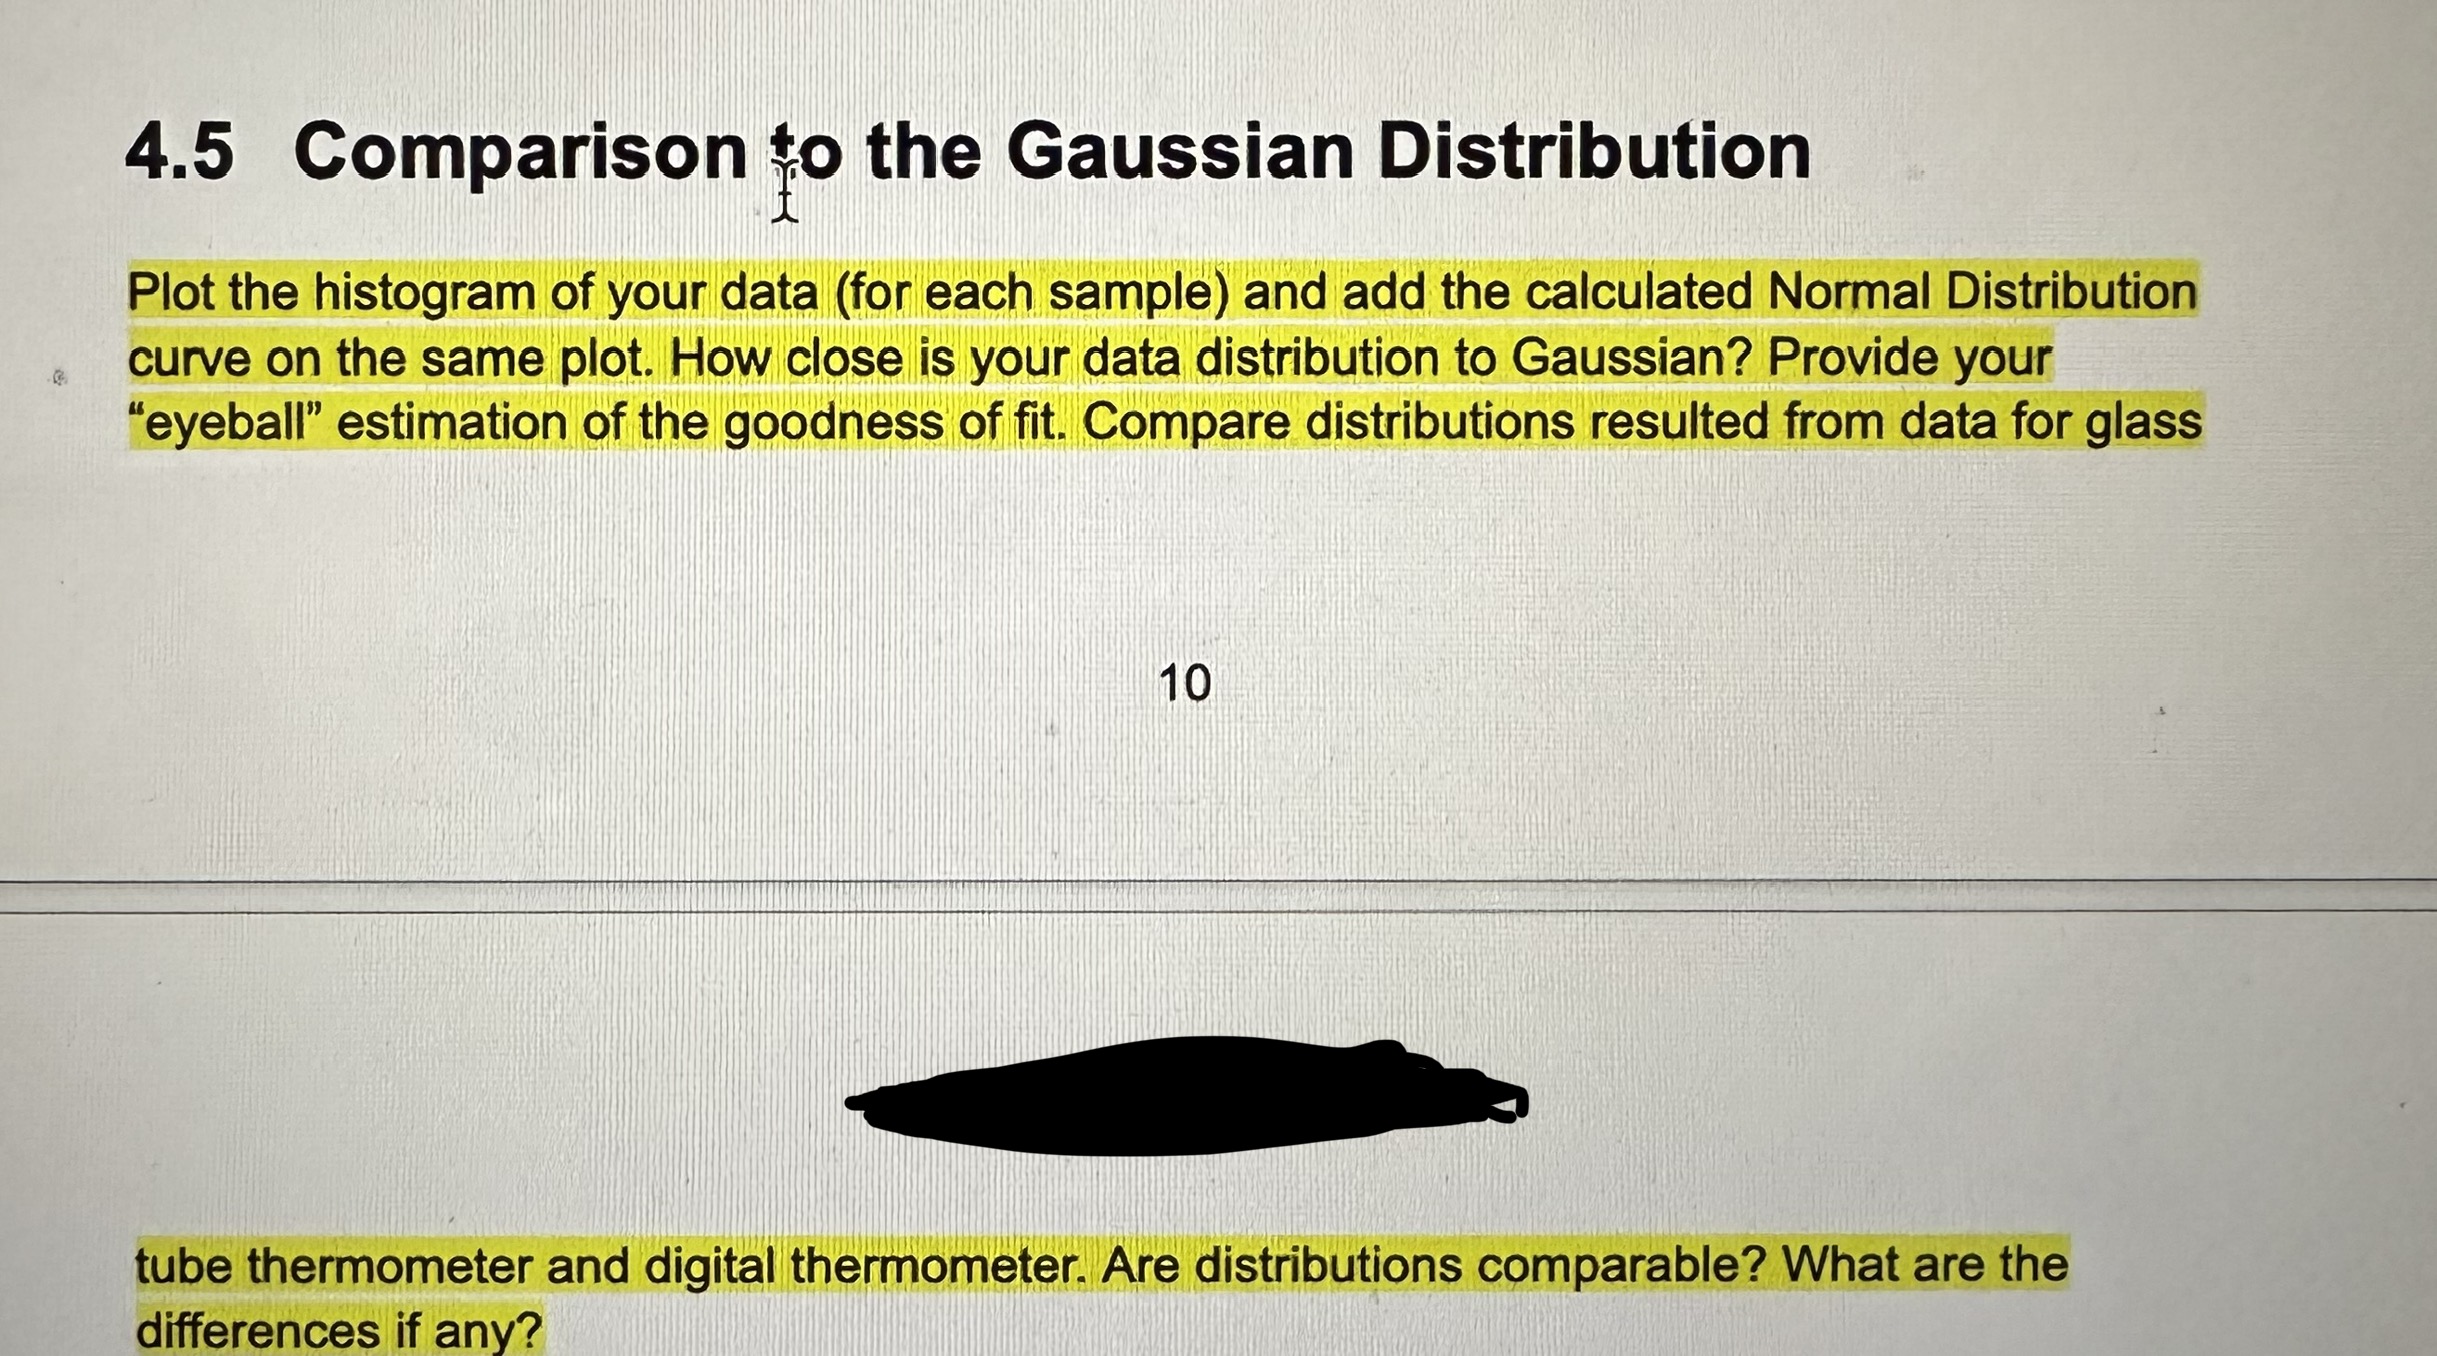
4.5 Comparison to the Gaussian Distribution Plot the histogram of your data (for each sample) and add the calculated Normal Distribution curve on the


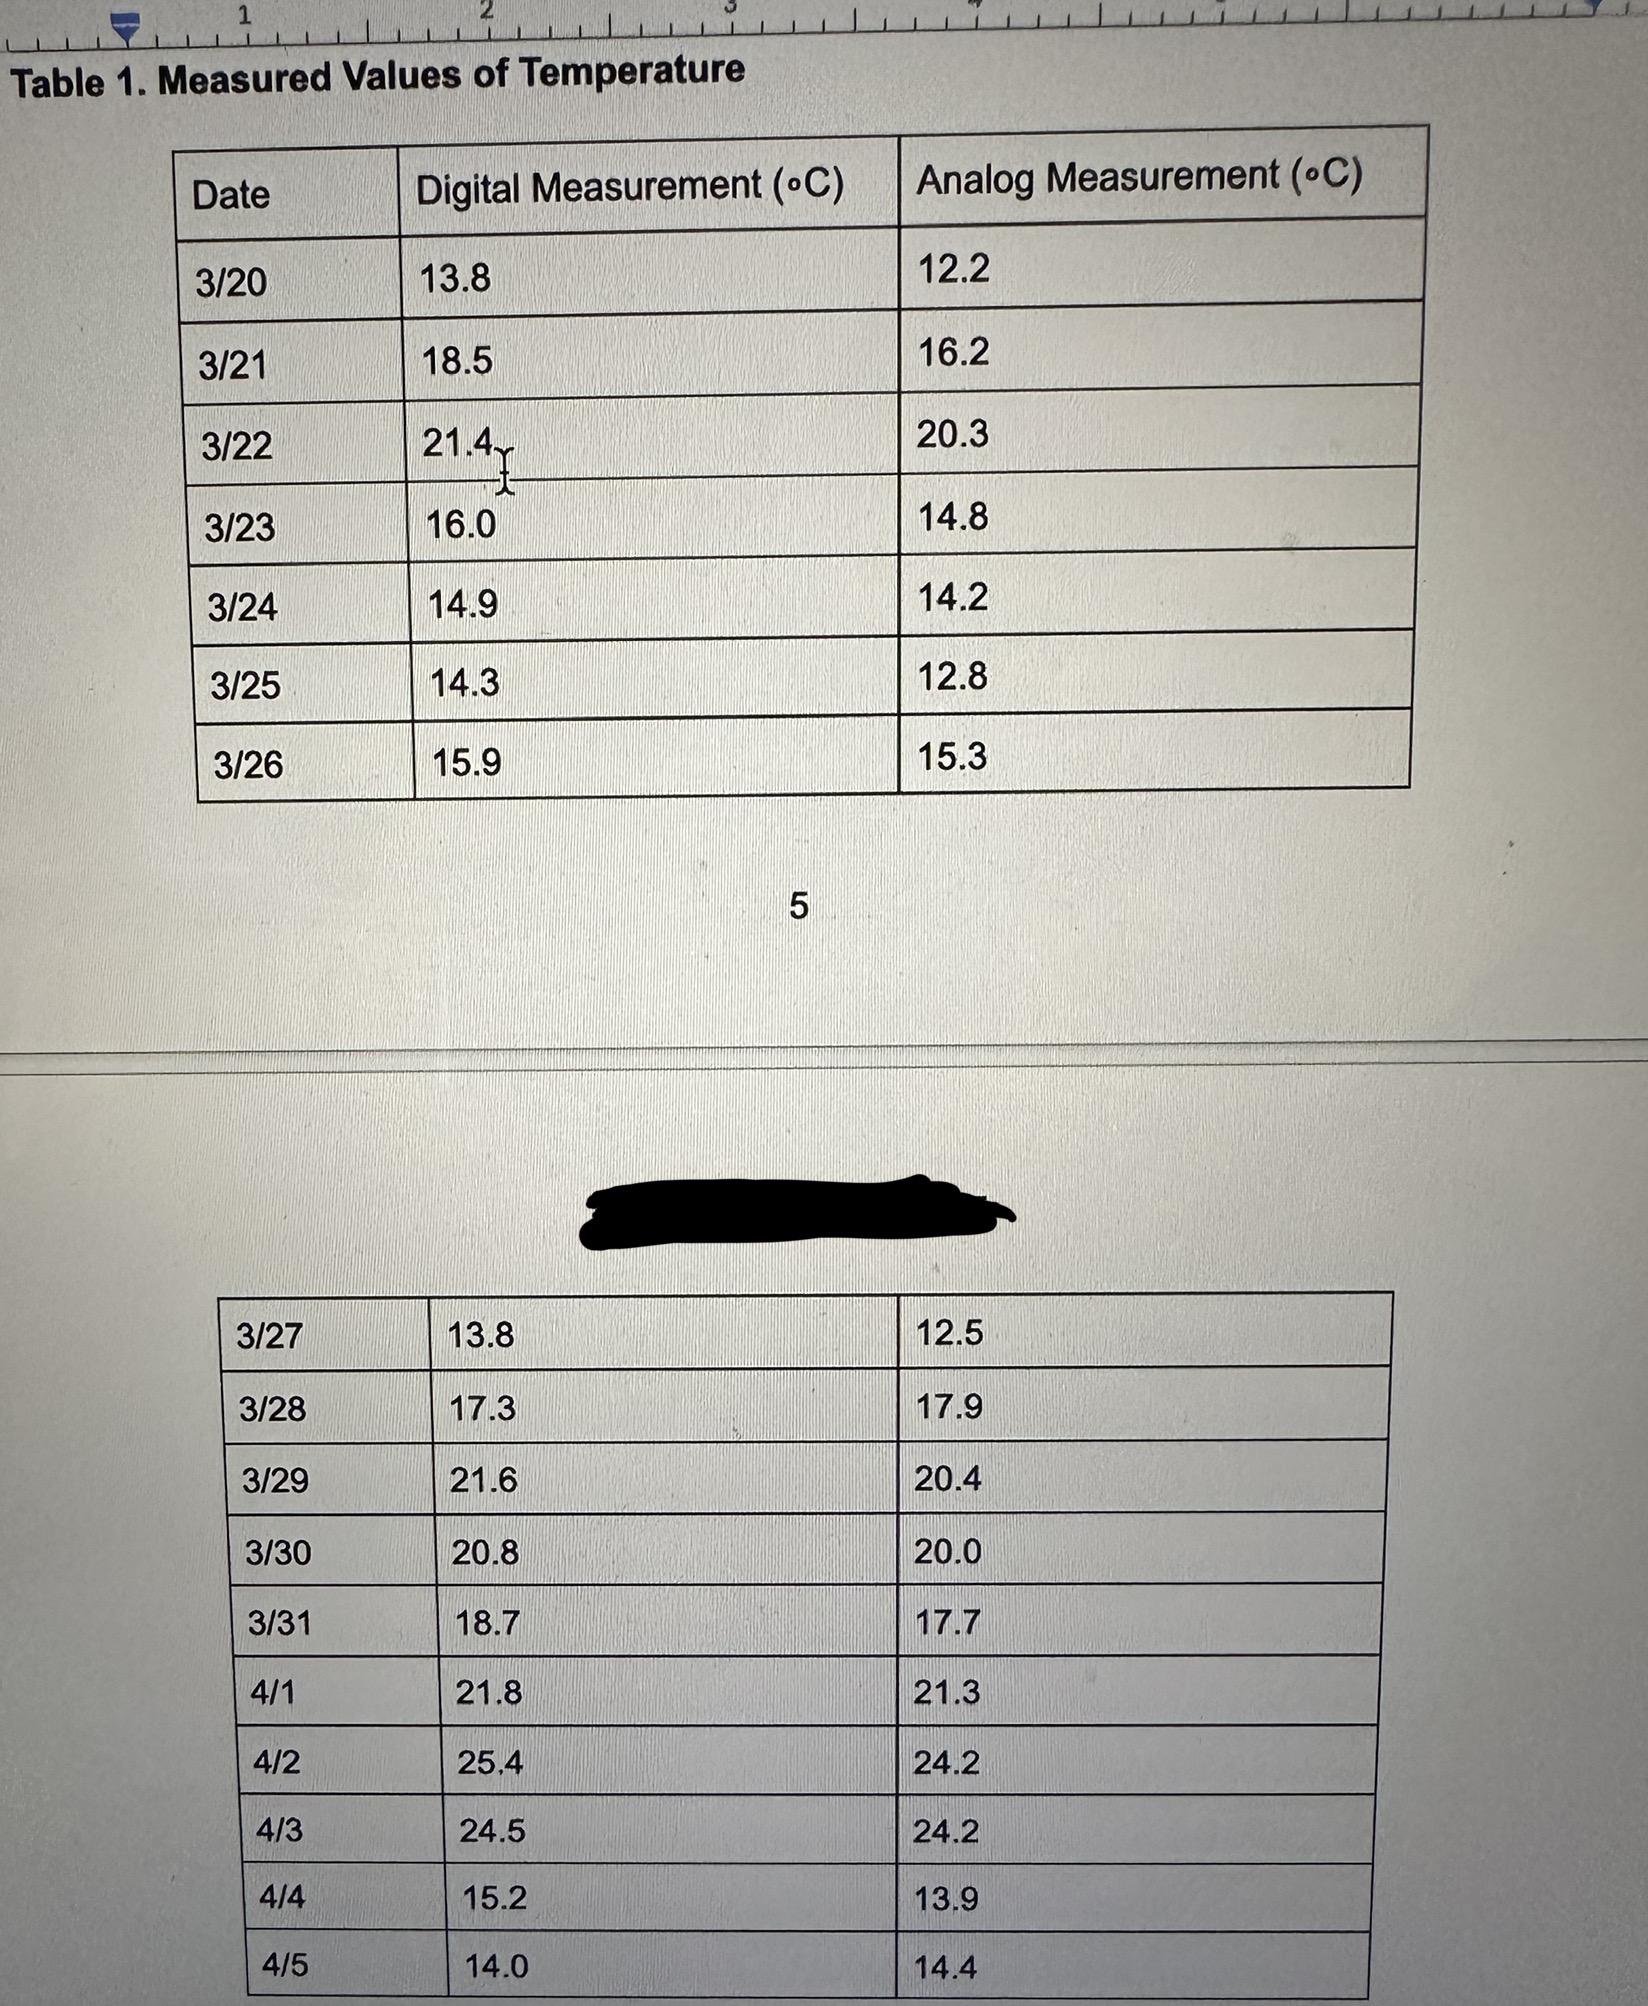
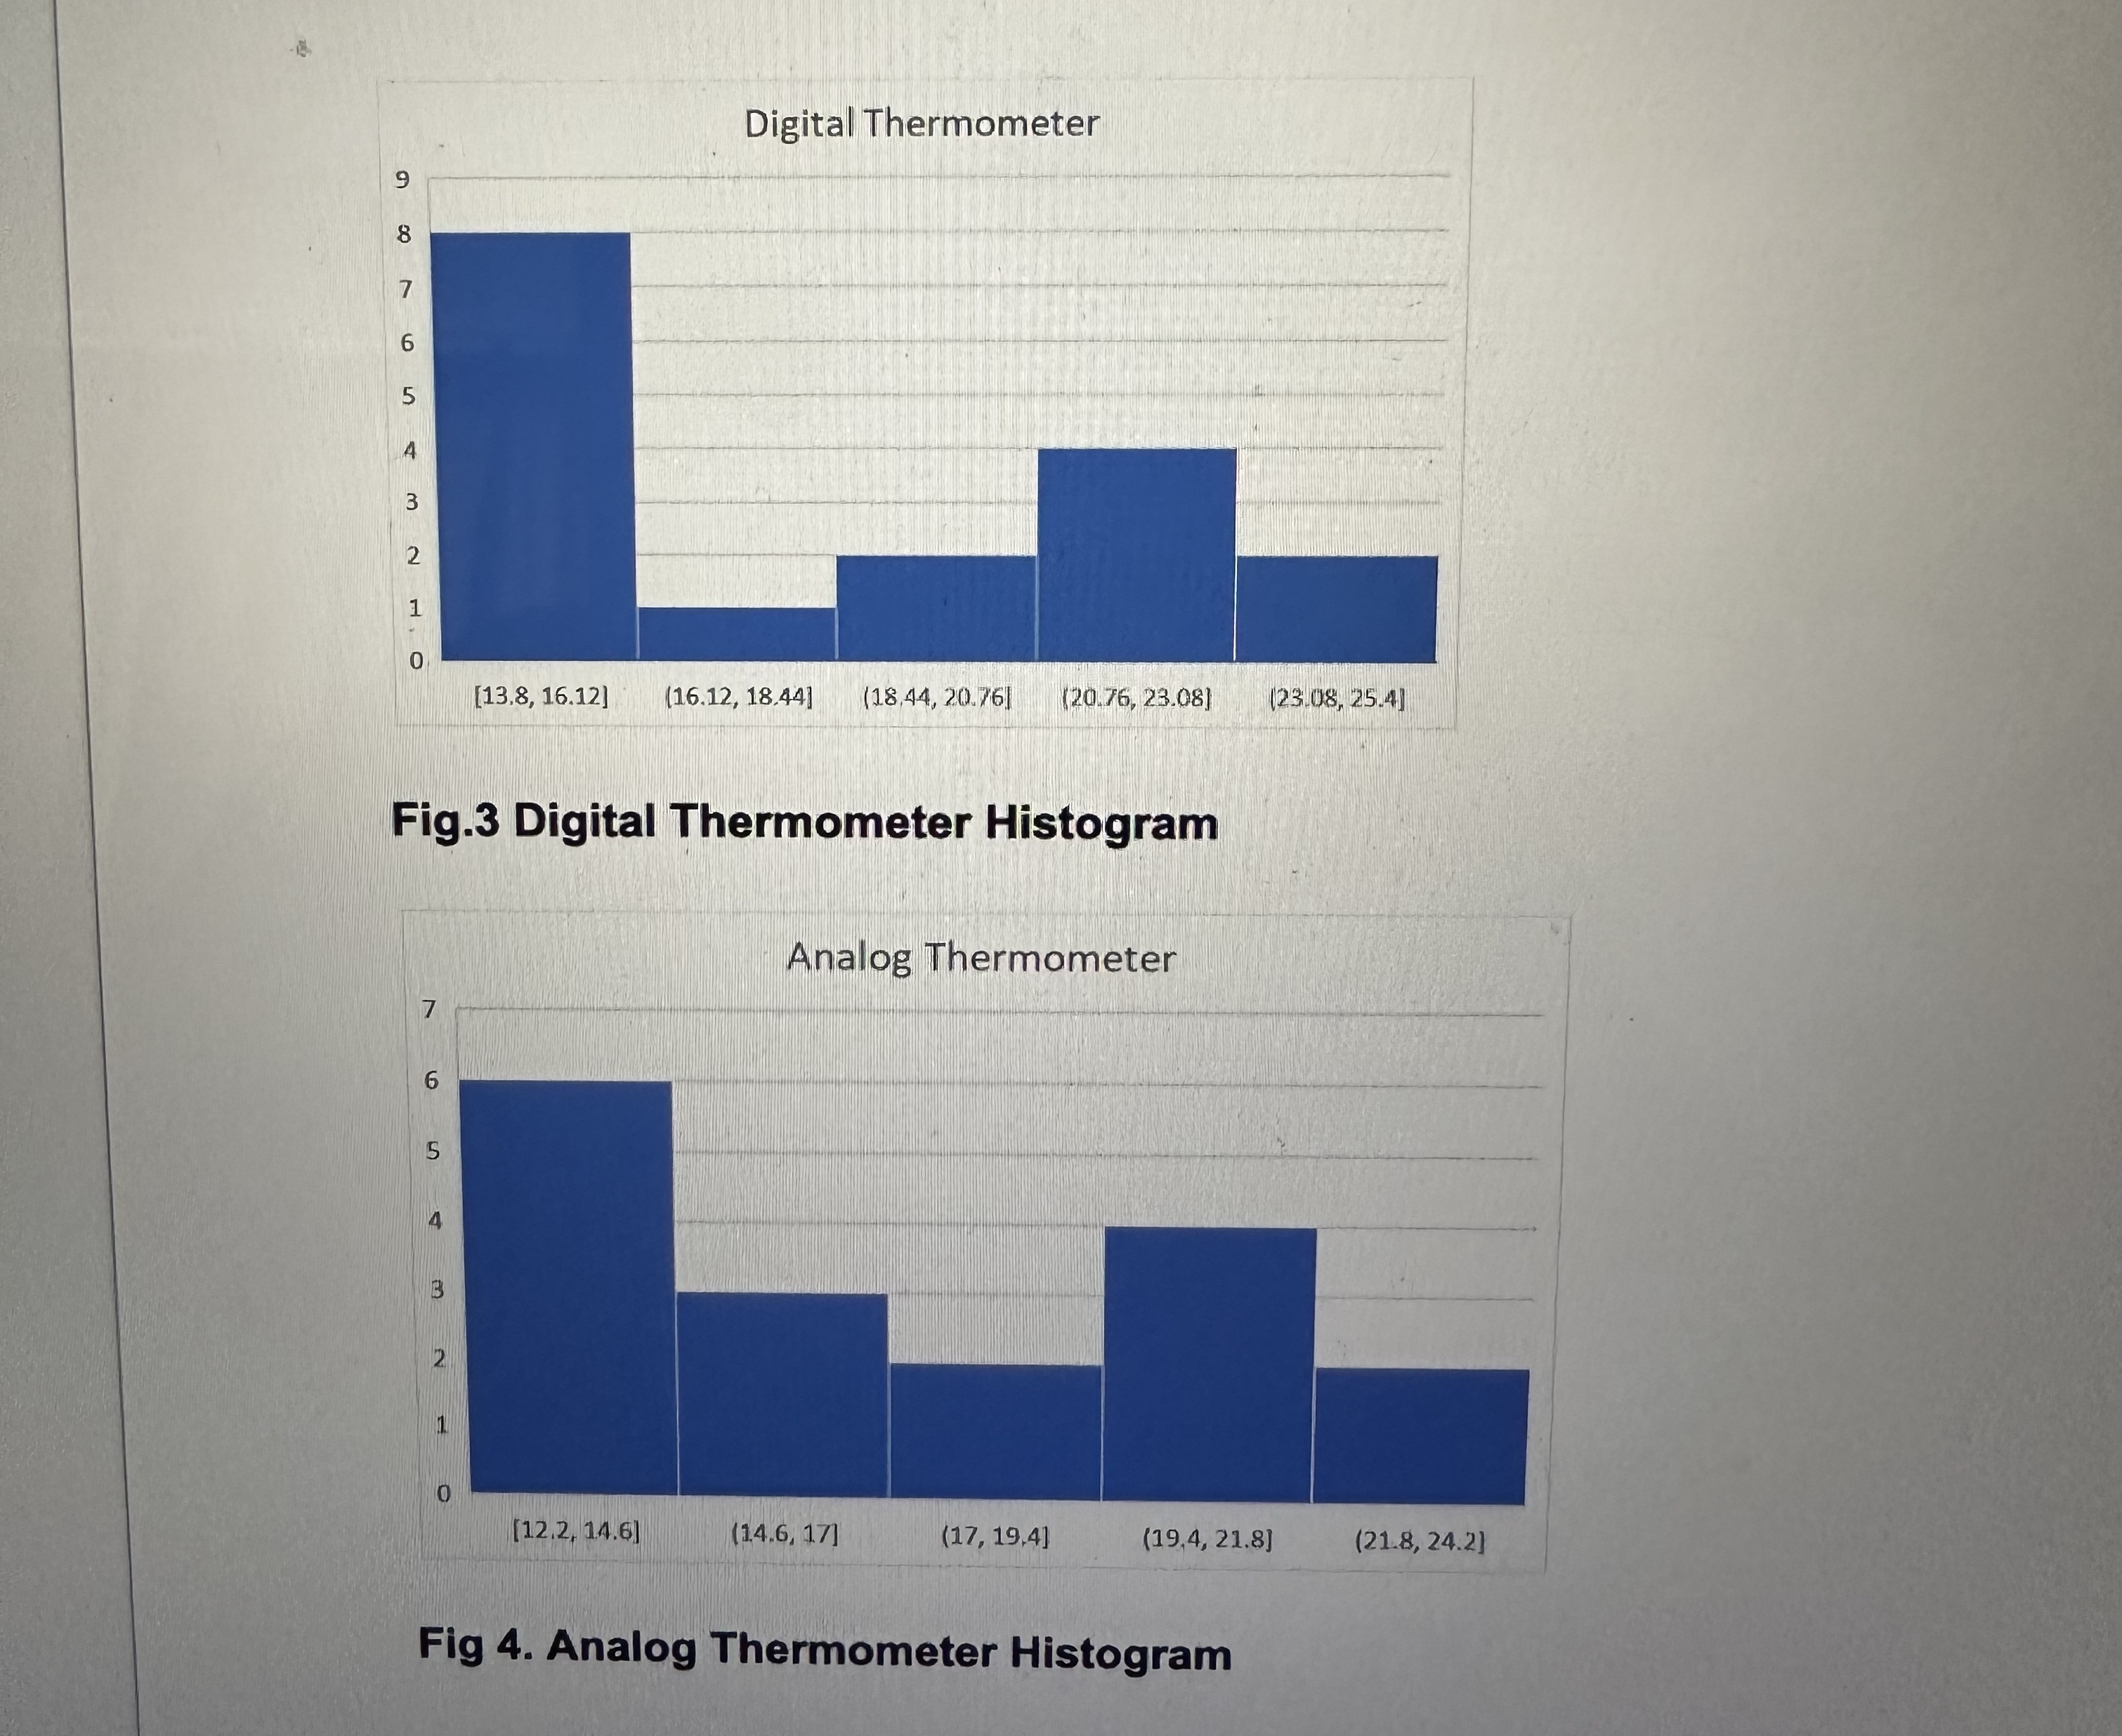
4.5 Comparison to the Gaussian Distribution Plot the histogram of your data (for each sample) and add the calculated Normal Distribution curve on the same plot. How close is your data distribution to Gaussian? Provide your "eyeball" estimation of the goodness of fit. Compare distributions resulted from data for glass 10 tube thermometer and digital thermometer. Are distributions comparable? What are the differences if any? Table 1. Measured Values of Temperature Date Digital Measurement (C) Analog Measurement (C) 3/20 13.8 12.2 3/21 18.5 16.2 3/22 21.4 20.3 3/23 16.0 14.8 3/24 14.9 14.2 3/25 14.3 12.8 3/26 15.9 15.3 5 3/27 13.8 12.5 3/28 17.3 17.9 3/29 21.6 20.4 3/30 20.8 20.0 3/31 18.7 17.7 4/1 21.8 21.3 4/2 25.4 24.2 4/3 24.5 24.2 4/4 15.2 13.9 4/5 14.0 14.4 9 8 765 3 2 1 0 Digital Thermometer [13.8, 16.12] (16.12, 18.44] (18,44, 20.76] (20.76, 23.08] (23.08, 25.4) Fig.3 Digital Thermometer Histogram Analog Thermometer 7 6 S B 2 1 [12.2, 14.6] (14.6, 17] (17, 19.4] (19,4, 21.8] (21.8, 24.2] Fig 4. Analog Thermometer Histogram
Step by Step Solution
There are 3 Steps involved in it
Step: 1

Get Instant Access to Expert-Tailored Solutions
See step-by-step solutions with expert insights and AI powered tools for academic success
Step: 2

Step: 3

Ace Your Homework with AI
Get the answers you need in no time with our AI-driven, step-by-step assistance
Get Started


