Answered step by step
Verified Expert Solution
Question
1 Approved Answer
(4.5 points) From the spreadsheet data, select any 3 stocks and calculate the average return and standard deviation of returns for each of the three
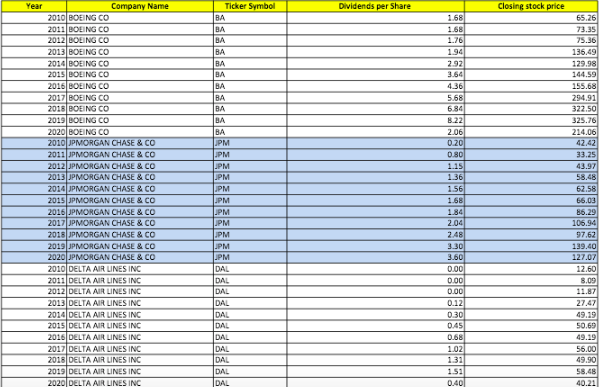
- (4.5 points) From the spreadsheet data, select any 3 stocks and calculate the average return and standard deviation of returns for each of the three stocks using 10 years of historical returns (2011 to 2020). Note: you will have to first calculate the stock returns for each year using the holding period return formula (see chapter 2). The spread sheet gives you year-end closing prices and dividends paid per share for each year. The average returns and standard deviation of returns over the ten year period can be calculated using the formulas given in chapter 8 ppt slides (see Valero example). Next, enter these values in the table below (Average return, Standard deviation) and also enter the names of the three stocks you selected.
Table 1
| Stock Name: | Average return | Standard deviation | Beta |
| Boeing Co | XX.XX% | XX.XX% | X.XX |
| JP Morgan Chase | XX.XX% | XX.XX% | X.XX |
| Delta Airlines | XX.XX% | XX.XX% | X.XX |
- (1.5 points) From the Yahoo Finance get the Beta for the three stocks and enter them in the last column of the table above.
- (1 point) If you were to construct a portfolio consisting of equal proportions of these three stocks, what would be the Beta of your portfolio?
Portfolio Beta = X.XX
- (1 point) Based on the portfolio beta you calculated above, what impact would a 10% decrease in the market portfolio return have on your portfolio return?
My portfolio should experience a XX.XX% decrease in return.
- (1 point) If you were expecting the overall market return to decrease over the next one year, how would you rebalance your portfolio such that you minimize your losses? Assume that you have to be invested in all three stocks but you can adjust the proportion invested in each stock. You have to hold at least 20% in each stock and you cannot own more than 45% in any one individual stock. In other words, construct a portfolio from the three stocks you selected such that you minimize your portfolio Beta within the constraints mentioned (i.e., the 20% min and 45%max ownership in any given stock). Enter your values in the table below:
Table 2
| Stock Name: | Beta | Proportion |
| Boeing Co | X.XX | XX% |
| JP Morgan Chase | X.XX | XX% |
| Delta Airlines | X.XX | XX% |
- (1 point) What is the portfolio beta after rebalancing?
Portfolio Beta: X.XX
WILL GIVE THUMBS UP AND POSITIVE RATING IF YOU CAN HELP WITH ALL PARTS!
Year Dividends per Share Closing stock price 1.68 1.68 1.76 1.94 Company Name 2010 BOEING CO 2011 BOEING CO 2012 BOEING CO 2013 BOEING CO 2014 BOEING CO 2015 BOEING CO 2016 BOEING CO 2017 BOEING CO 2018 BOEING CO 2019 BOLING CO 2020 BOEING CO 2010 JPMORGAN CHASE & CO 2011 JPMORGAN CHASE & CO 2012 JPMORGAN CHASE & CO 2013 JPMORGAN CHASE & CO 2014 JPMORGAN CHASE & CO 2015 JPMORGAN CHASE & CO 2016 JPMORGAN CHASE & CO 2017 JPMORGAN CHASE & CO 2018 JPMORGAN CHASE & CO 2019 JPMORGAN CHASE & CO 2020 JPMORGAN CHASE & CO 2010 DELTA AIRLINES INC 2011 DELTA AIRLINES INC 2012 DELTA AIR LINES INC 2013 DELTA AIRLINES INC 2014 DELTA AIRLINES INC 2015 DELTA AIR LINES INC 2016 DELTA AIRLINES INC 2017 DELTA AIRLINES INC 2018 DELTA AIRLINES INC 2019 DELTA AIR LINES INC 2020 DELTA AIRLINES INC Ticker Symbol BA BA BA | BA BA BA BA BA BA BA JPM JPM JPM JPM JPM JPM JPM JPM JPM JPM JPM DAL DAL DAL DAL DAL 2.92 3.64 4.36 5.68 6.84 B.22 2.06 0.20 0.80 1.15 1.36 1.56 1.68 1.84 2.04 2.48 3.30 3.60 0.00 0.00 0.00 0.12 0.30 0.45 0.68 1.02 131 1.51 0.40) 65.26 73.35 75.36 136.49 129.98 144.59 155.68 294.91 322.50 325.76 214.06 42.42 33.25 43.97 58.48 62.58 66.03 86.29 106.94 97.62 139.40 127.07 12.60 8.09 11.87 27.47 49.19 50.69 49.19 56.00 49.90 58.48 40.21 DAL DAL DAL DAL DAL DAL Year Dividends per Share Closing stock price 1.68 1.68 1.76 1.94 Company Name 2010 BOEING CO 2011 BOEING CO 2012 BOEING CO 2013 BOEING CO 2014 BOEING CO 2015 BOEING CO 2016 BOEING CO 2017 BOEING CO 2018 BOEING CO 2019 BOLING CO 2020 BOEING CO 2010 JPMORGAN CHASE & CO 2011 JPMORGAN CHASE & CO 2012 JPMORGAN CHASE & CO 2013 JPMORGAN CHASE & CO 2014 JPMORGAN CHASE & CO 2015 JPMORGAN CHASE & CO 2016 JPMORGAN CHASE & CO 2017 JPMORGAN CHASE & CO 2018 JPMORGAN CHASE & CO 2019 JPMORGAN CHASE & CO 2020 JPMORGAN CHASE & CO 2010 DELTA AIRLINES INC 2011 DELTA AIRLINES INC 2012 DELTA AIR LINES INC 2013 DELTA AIRLINES INC 2014 DELTA AIRLINES INC 2015 DELTA AIR LINES INC 2016 DELTA AIRLINES INC 2017 DELTA AIRLINES INC 2018 DELTA AIRLINES INC 2019 DELTA AIR LINES INC 2020 DELTA AIRLINES INC Ticker Symbol BA BA BA | BA BA BA BA BA BA BA JPM JPM JPM JPM JPM JPM JPM JPM JPM JPM JPM DAL DAL DAL DAL DAL 2.92 3.64 4.36 5.68 6.84 B.22 2.06 0.20 0.80 1.15 1.36 1.56 1.68 1.84 2.04 2.48 3.30 3.60 0.00 0.00 0.00 0.12 0.30 0.45 0.68 1.02 131 1.51 0.40) 65.26 73.35 75.36 136.49 129.98 144.59 155.68 294.91 322.50 325.76 214.06 42.42 33.25 43.97 58.48 62.58 66.03 86.29 106.94 97.62 139.40 127.07 12.60 8.09 11.87 27.47 49.19 50.69 49.19 56.00 49.90 58.48 40.21 DAL DAL DAL DAL DAL DALStep by Step Solution
There are 3 Steps involved in it
Step: 1

Get Instant Access to Expert-Tailored Solutions
See step-by-step solutions with expert insights and AI powered tools for academic success
Step: 2

Step: 3
Ace Your Homework with AI
Get the answers you need in no time with our AI-driven, step-by-step assistance
Get Started