

Answered step by step
Verified Expert Solution
Question
1 Approved Answer
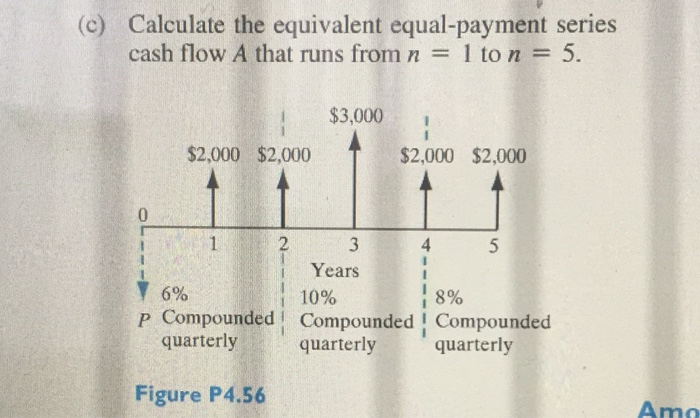
4.56. Consider the cash flow diagram shown in Fig- ure P4 56, which represents three different interest rates applicable over the five-year time span shown.
Step by Step Solution
There are 3 Steps involved in it
Step: 1

Get Instant Access to Expert-Tailored Solutions
See step-by-step solutions with expert insights and AI powered tools for academic success
Step: 2

Step: 3
Ace Your Homework with AI
Get the answers you need in no time with our AI-driven, step-by-step assistance
Get Started
Finance At 40 Financial Intelligence
Authors: MOIRA O'NEILL Moira O'Neill
1st Edition
1408101114, 978-1408101117