

Answered step by step
Verified Expert Solution
Question
1 Approved Answer
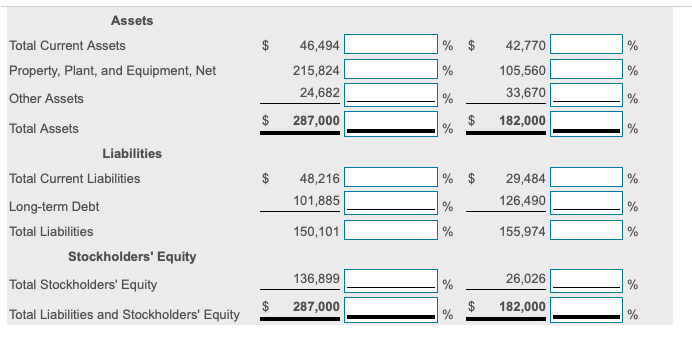
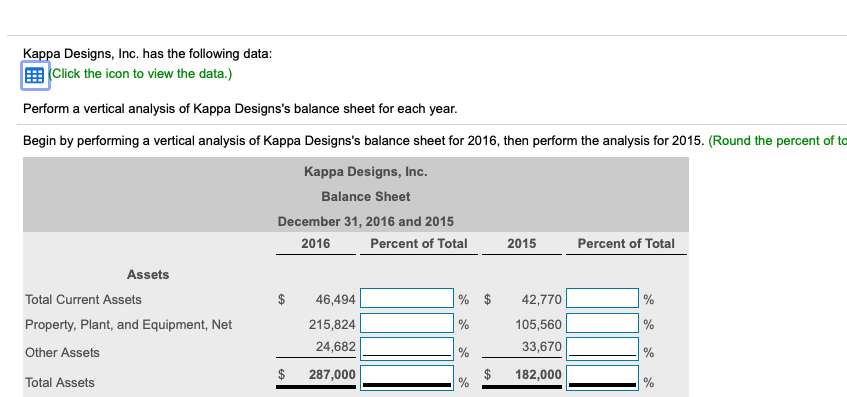
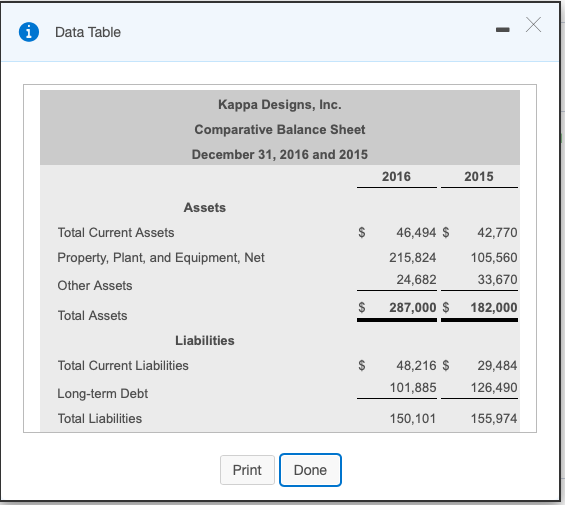
46,494 % % % 42,770 105,560 33,670 215,824 24,682 % % $ 287,000 $ 182,000 % Assets Total Current Assets Property, Plant, and Equipment, Net
Step by Step Solution
There are 3 Steps involved in it
Step: 1

Get Instant Access to Expert-Tailored Solutions
See step-by-step solutions with expert insights and AI powered tools for academic success
Step: 2

Step: 3
Ace Your Homework with AI
Get the answers you need in no time with our AI-driven, step-by-step assistance
Get Started
Audit And Accounting Guide State And Local Governments
Authors: AICPA
1st Edition
1945498587, 978-1945498589