

Answered step by step
Verified Expert Solution
Question
1 Approved Answer
4.73 The table below shows average daily sales of Rice Krispies in the month of June in 74 Noodles & Company restaurants. (a) Make
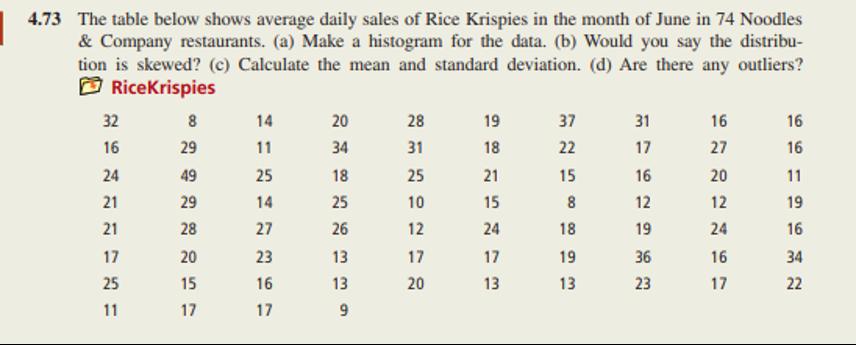
4.73 The table below shows average daily sales of Rice Krispies in the month of June in 74 Noodles & Company restaurants. (a) Make a histogram for the data. (b) Would you say the distribu- tion is skewed? (c) Calculate the mean and standard deviation. (d) Are there any outliers? RiceKrispies 32 8 14 20 28 19 37 31 16 16 16 29 24 49 22 21 21 17 25 =5 11 2422257 11 34 31 18 22 17 27 16 25 18 25 21 15 16 20 11 29 14 25 10 15 8 12 28 20 15 17 2367 26 12 24 13 17 17 16 13 20 273 18 19 19 36 13 13 23 2267 19 16 34 22 22 17 6
Step by Step Solution
There are 3 Steps involved in it
Step: 1

Get Instant Access to Expert-Tailored Solutions
See step-by-step solutions with expert insights and AI powered tools for academic success
Step: 2

Step: 3
Ace Your Homework with AI
Get the answers you need in no time with our AI-driven, step-by-step assistance
Get Started
Differential Equations A Maple™ Supplement
Authors: Robert P Gilbert, George C Hsiao, Robert J Ronkese
2nd Edition
1000402525, 9781000402520