

Question
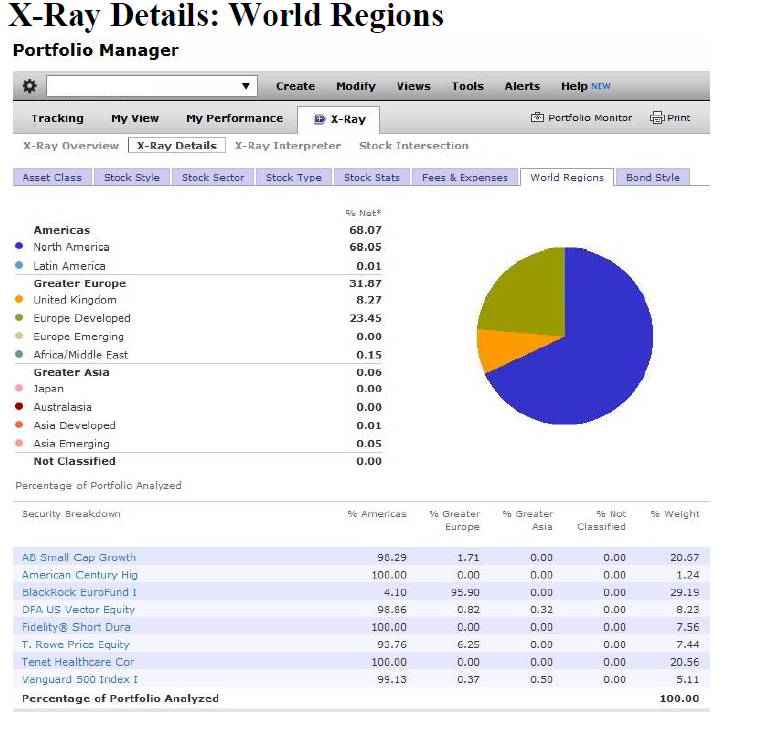
4.Now, lets look at the allocation among different regions. In the X-Ray Details: World Regionssection(located in the supplemental document titled: Documents for the Case Study).
4.Now, lets look at the allocation among different regions. In the X-Ray Details: World Regionssection(located in the supplemental document titled: Documents for the Case Study). Answer the following questions:a.Comparedto the desired World Region Allocation, should your friend invest more in the international markets? Please explain your answerin detail.b.Among the funds inyour friends portfolio, which funds are heavily invested in the international market? Should your friend buy or sell more of these fundsin order to meet the desired World Region Allocation?
Step by Step Solution
There are 3 Steps involved in it
Step: 1

Get Instant Access to Expert-Tailored Solutions
See step-by-step solutions with expert insights and AI powered tools for academic success
Step: 2

Step: 3
Ace Your Homework with AI
Get the answers you need in no time with our AI-driven, step-by-step assistance
Get Started
Innovation And Finance
Authors: Andreas Pyka, Hans-Peter Burghof
1st Edition
0415696852, 978-0415696852