

Answered step by step
Verified Expert Solution
Question
1 Approved Answer
4v, Course Hero x|+ X if] https://egcc.instructure.com/courses/19587/assignments/489739 a: Final Exam G People Pages Files Syllabus Account Modules to Dashboard Google Drlve g Ofce 365 Courses
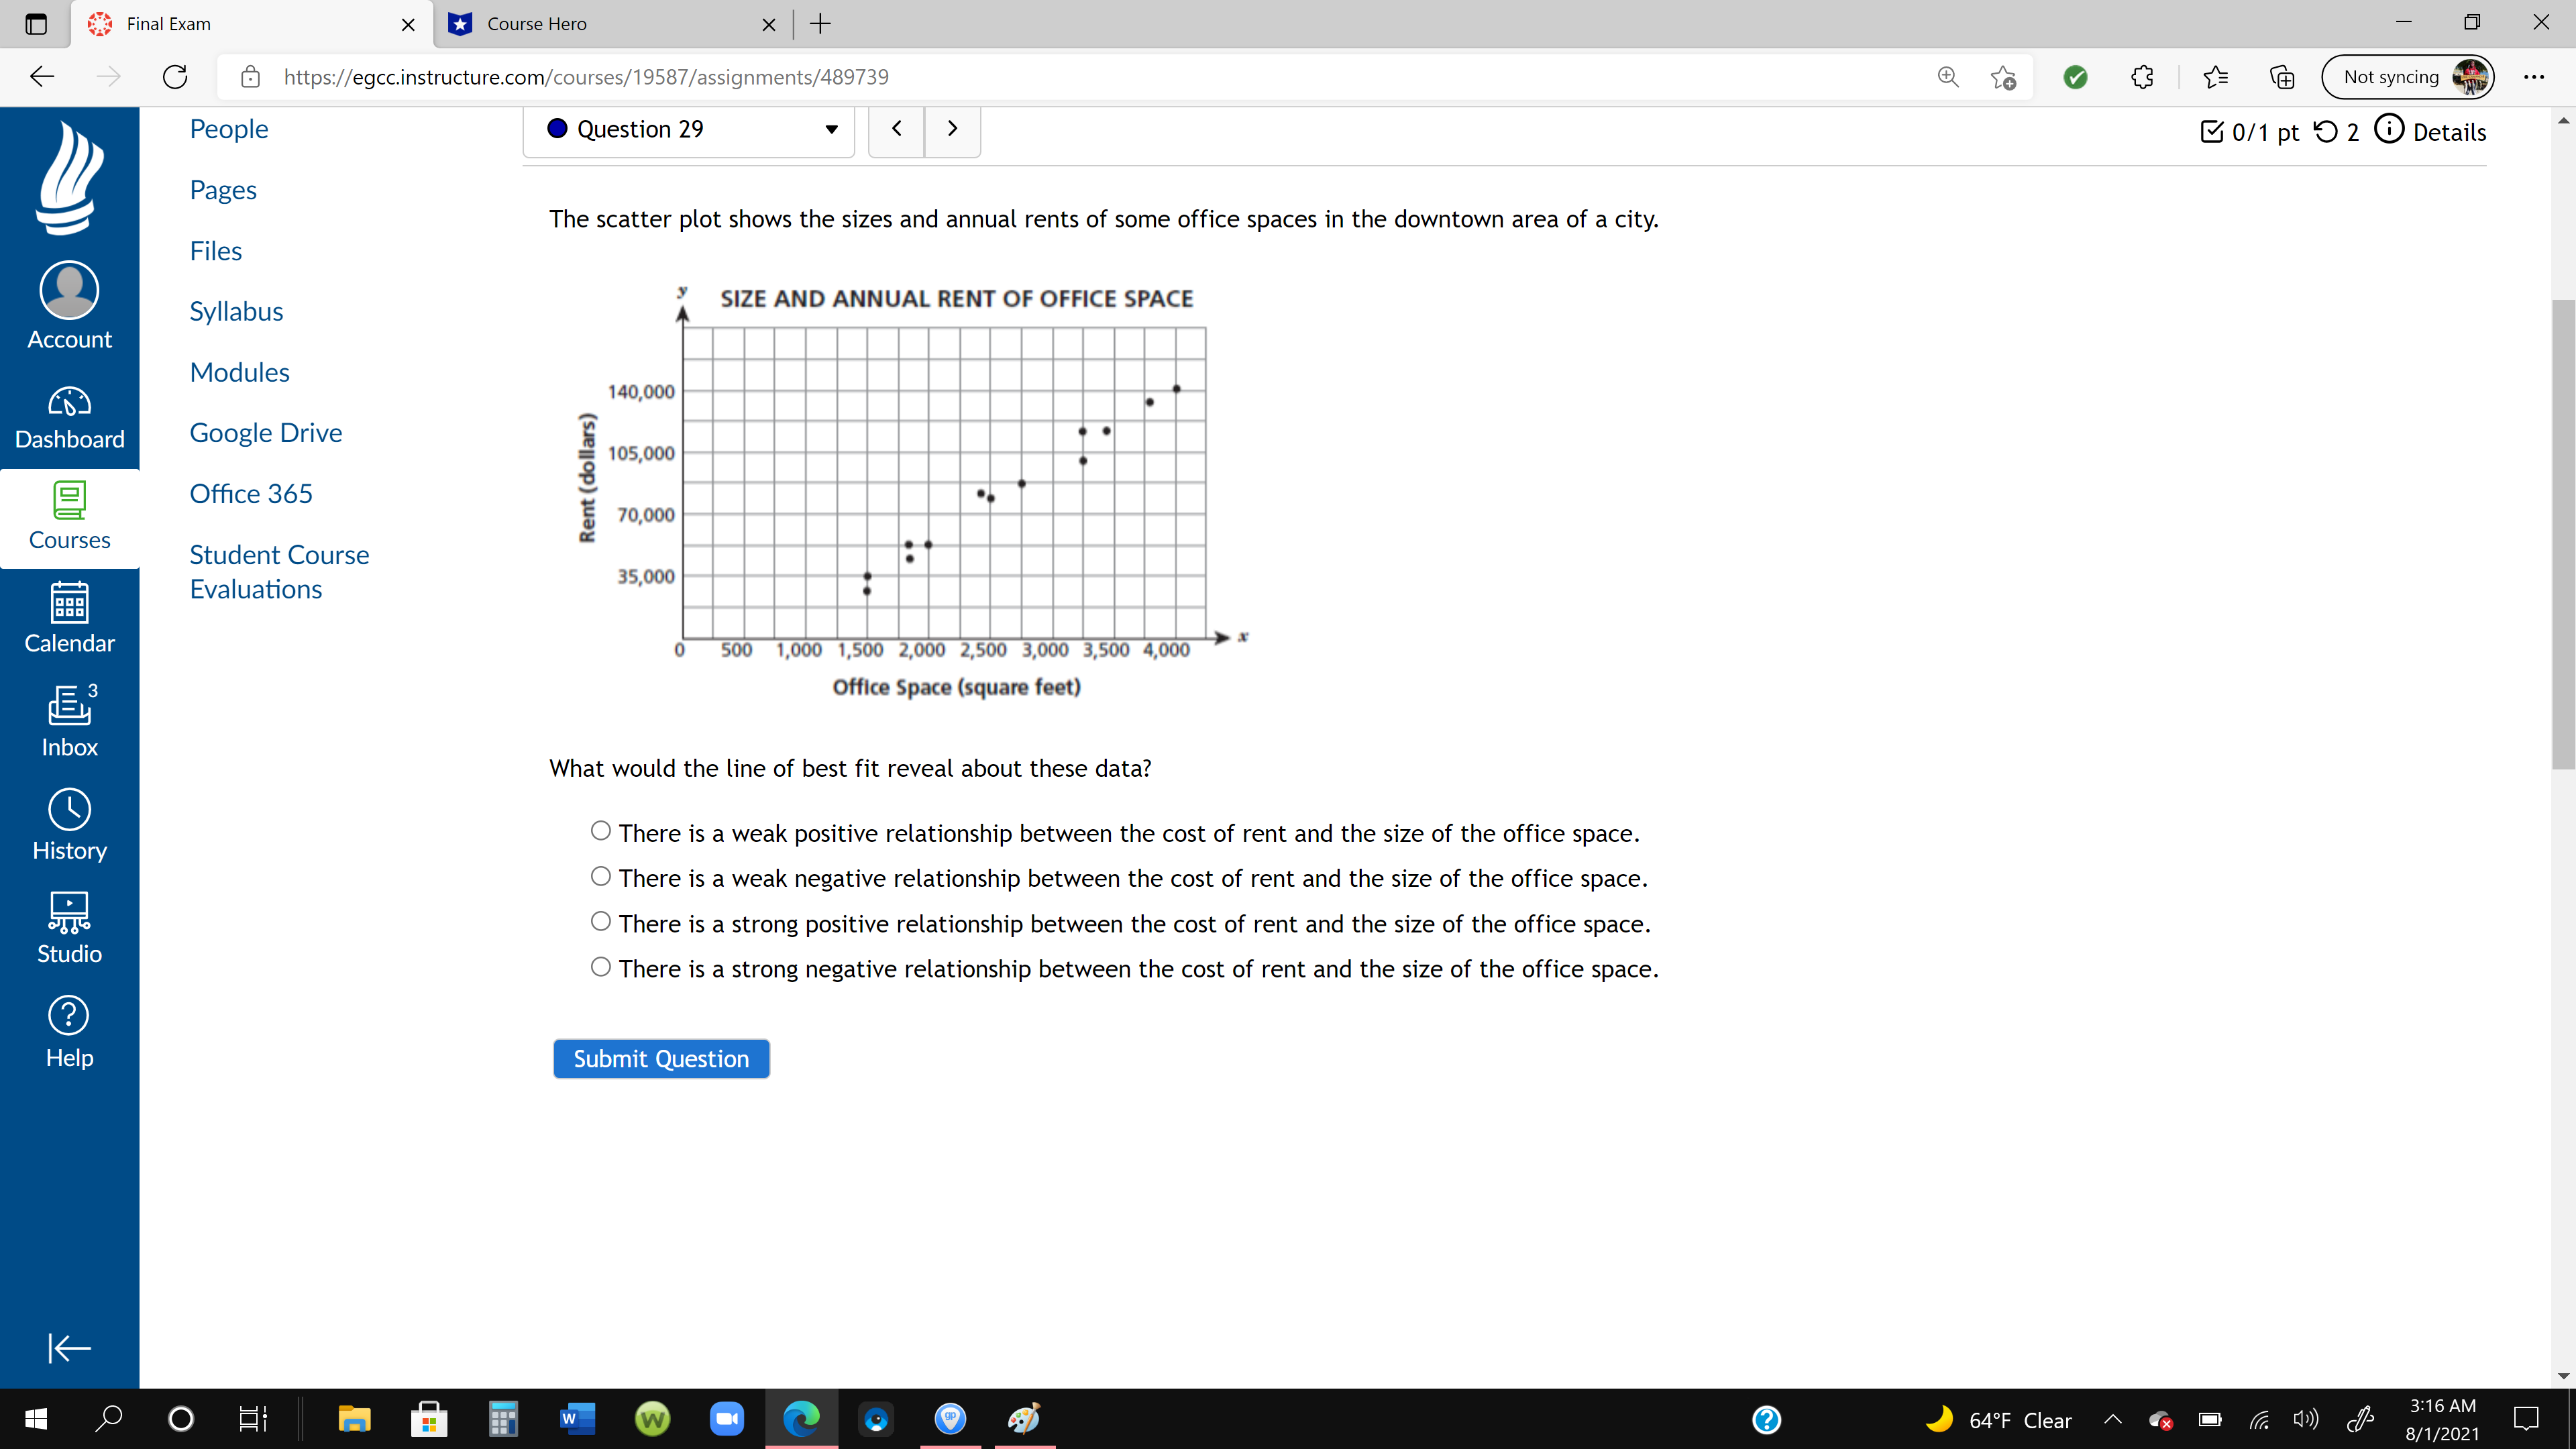 4v, Course Hero x|+ X if] https://egcc.instructure.com/courses/19587/assignments/489739 a: Final Exam G People Pages Files Syllabus Account Modules to Dashboard Google Drlve g Ofce 365 Courses Student Course Evaluations Calendar 7 lnbox Histow Studio Help 0 Question 29 The scatter plot shows the sizes and annual rents of some office spaces in the downtown area of a city. ' SIZE AND ANNUAL RENT OF OFFICE SPACE A v ( ) 0 500 S : 1,000 1.500 2,000 2,500 3.000 3,500 @000 cm:- pr0 (square foot) What would the line of best fit reveal about these data? 0 There is a weak positive relationship between the cost of rent and the size of the office space. 0 There is a weak negative relationship between the cost of rent and the size of the office space. 0 There is a strong positive relationship between the cost of rent and the size of the office space. 0 There is a strong negative relationship between the cost of rent and the size of the office space. Submit Question J 64 Clear 8 0/1 pt 0 2 (D Details M 9
 Step by Step Solution
There are 3 Steps involved in it
Step: 1

Get Instant Access to Expert-Tailored Solutions
See step-by-step solutions with expert insights and AI powered tools for academic success
Step: 2

Step: 3
Ace Your Homework with AI
Get the answers you need in no time with our AI-driven, step-by-step assistance
Get Started
Beginning Algebra A Text/Workbook
Authors: Charles P McKeague
2nd Edition
1483271242, 9781483271248