4.What offer price would you set for the Ferrari IPO? Discuss potential pricing strategy.
Should we extract everything out, but will we sell it all?
Value just below what they think the value is, stock goes IPO
Good = sell all shares
Bad = maybe you left some value on the table
This final point (point #4) is the overall assignment for the case, but all of the points are necessary for the case.
You need to provide the recommended offer price of RACE, Ferrari's stock, in dollars. The goal is to see what it should be offered on the New York Stock Exchange. There is an exchange rate published in the exhibits that was quoted the day before RACE had its IPO (10/09/2015).
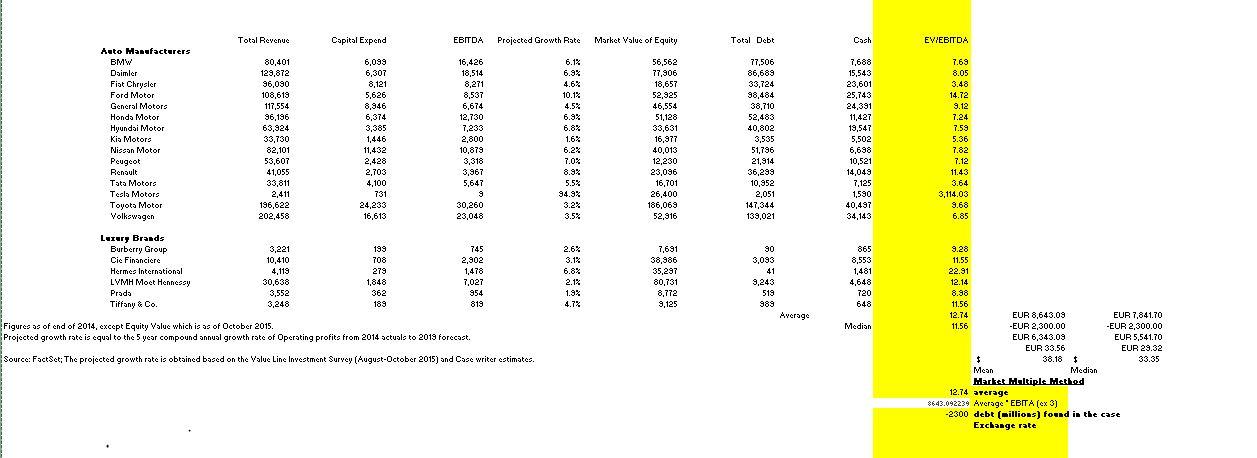
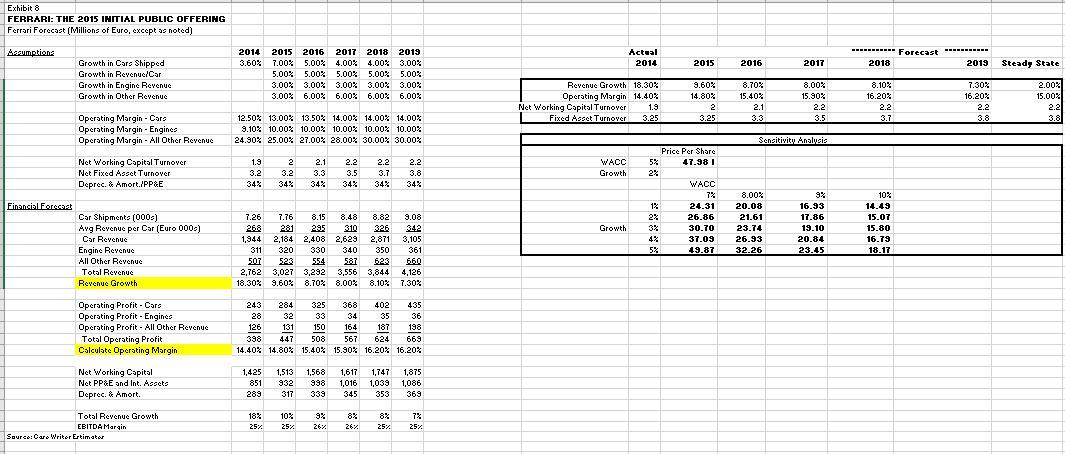
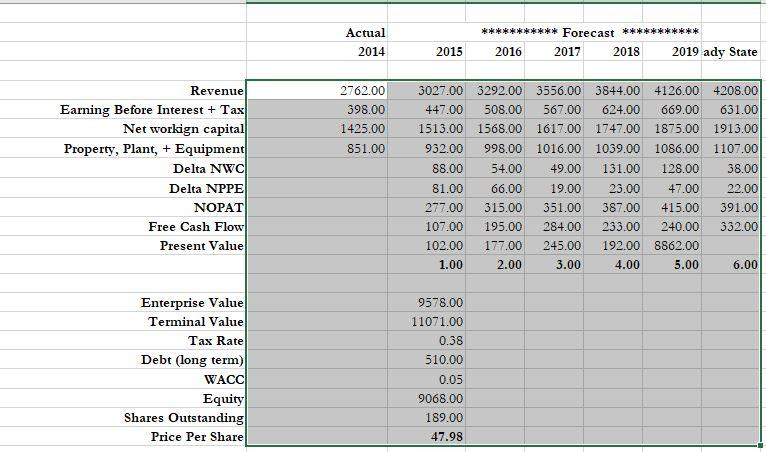
Pach is 8 *****: of October 2015 rofit from 2014 tuplato 2018 forces ugust-October 2015) and Case writer estimates. EUR 8,643.08 EUR 7,841.70 -EUR 2,300.00 EUR 2,300.00 DO EUR 29.82 38.16 33.35 Market Haltiple Mathed 12.74 average Sen debt billions found in the cas Exchange rate Exhibit 8 FERRARI: THE 2015 INITIAL PUBLIC OFFERING Ferrari Forecast (Millions of Euro, except as noted) Assumption: Actual 2014 ----------- Forecast ----------- 2018 2019 2015 2016 2017 Steady State Growth in Cars Shipped Growth in Revenue/Car Growth in Engine Revenue Growth in Other Revenue 2014 2015 2016 2017 2018 2019 3.60% 7.00% 5.00% 4.00% 4.00% 3.00% 5.00% 5.00% 5.00% 5.00% 5.00% % % 3.00% 3.00% 3,00% 3.00% 3.00% % % % 3.00% 6.00% 6.00% 6.00% 6.00% Revenue Growth 18.30% Operating Margin 14.40% Net Working Capital Turnover 1.9 Fixed Asset Turnover 3.25 9.60% 14.80% 2 3.25 8.70% 15.40% 2.1 3.3 8.00% 15.902 2.2 3.5 8.10% 16.20% 2.2 3.7 7.30% 16.20% 2.2 3.8 2.00% 15.00% 2.2 Operating Margin - Cars Operating Margin - Engines Operating Margin - All Other Revenue 12.50% 13.00% 13.50% 14.00% 14.00% 14.00% 9.10% 10.00% 10.00% 10.00% 10.00% 10.00% 24.90% 25.00% 27.00% 28.00% 30.00% 30.00% Sensitivity analysis no 2.2 Net Working Capital Turnover Net Fixed Agget Turnover Deprec. & Amort./PPE 1.9 3.2 343 2 3.2 34% 2.1 3.3 34% 2.2 3.5 343 2.2 3.7 343 WACC Growth 343 Price Per Share 5% 47.381 2% WACC 72 12 24.31 23 26.86 3% 30.70 4% 37.03 5% 49.87 Financial Forecast Growth Car Shipments (0000) : Avg Revenue per Car (Euro 000) Car Revenue Engine Revenue All Other Revenue Total Revenue Revenue Growth 7.26 7.76 8.15 8.48 8.82 9.08 268 281 295 310 326 342 1,944 2,184 2,408 2,629 2,871 3,105 311 320 330 340 350 361 507 523 554 587 623 660 2,762 3,027 3,292 3,556 3,844 4,126 18.30% 9.60% 8.70% 8.00% 8.10% 7.30% % % % 8.00% 20.08 21.61 23.74 26.93 32.26 9% % 16.93 17.86 19.10 20.84 23.45 10% 14.45 15.07 15.80 16.79 18.17 Operating Profit Core Operating Profit - Engines Operating Profit - All Other Revenue Total Operating Profit Calculate Operating Margin 243 284 325 368 402 435 28 32 33 34 35 36 126 131 150 164 187 198 398 447 508 567 624 669 14.40% 14.80% 15.40% 15.90% 16.20% 16.20% Net Working Capital Net PP&E and Int. Asscto Deprec. & Amort. 1,425 851 289 1,513 1,568 932 998 317 339 1,617 1,747 1,875 1,016 1,039 1,086 345 353 369 Total Revenue Growth EBITDA Margin Source: Care Writer Ertimeter 18% 25% 10% 25% 9% 26% % % 8% 26% % 8% 25% 7% 25% Actual 2014 *********** Forecast ******* 2016 2017 2018 2019 ady State 2015 2762.00 398.00 1425.00 851.00 Revenue Earning Before Interest + Tax Net workign capital Property, Plant, + Equipment Delta NWC Delta NPPE NOPAT Free Cash Flow Present Value 3027.00 3292.00 3556.00 3844.00 4126.00 4208.00 447.00 508.00 567.00 624.00 669.00 631.00 1513.00 1568.00 1617.00 1747.00 1875.00 1913.00 932.00 998.00 1016.00 1039.00 1086.00 1107.00 88.00 54.00 49.00 131.00 128.00 38.00 81.00 66.00 19.00 23.00 47.00 22.00 277.00 315.00 351.00 387.00 415.00 391.00 107.00 195.00 284.00 233.00 240.00 332.00 102.00 177.00 245.00 192.00 8862.00 1.00 2.00 3.00 4.00 5.00 6.00 Enterprise Value Terminal Value Tax Rate Debt (long term) WACCI Equity Shares Outstanding Price Per Share 9578.00 11071.00 0.38 510.00 0.05 9068.00 189.00 47.98 Pach is 8 *****: of October 2015 rofit from 2014 tuplato 2018 forces ugust-October 2015) and Case writer estimates. EUR 8,643.08 EUR 7,841.70 -EUR 2,300.00 EUR 2,300.00 DO EUR 29.82 38.16 33.35 Market Haltiple Mathed 12.74 average Sen debt billions found in the cas Exchange rate Exhibit 8 FERRARI: THE 2015 INITIAL PUBLIC OFFERING Ferrari Forecast (Millions of Euro, except as noted) Assumption: Actual 2014 ----------- Forecast ----------- 2018 2019 2015 2016 2017 Steady State Growth in Cars Shipped Growth in Revenue/Car Growth in Engine Revenue Growth in Other Revenue 2014 2015 2016 2017 2018 2019 3.60% 7.00% 5.00% 4.00% 4.00% 3.00% 5.00% 5.00% 5.00% 5.00% 5.00% % % 3.00% 3.00% 3,00% 3.00% 3.00% % % % 3.00% 6.00% 6.00% 6.00% 6.00% Revenue Growth 18.30% Operating Margin 14.40% Net Working Capital Turnover 1.9 Fixed Asset Turnover 3.25 9.60% 14.80% 2 3.25 8.70% 15.40% 2.1 3.3 8.00% 15.902 2.2 3.5 8.10% 16.20% 2.2 3.7 7.30% 16.20% 2.2 3.8 2.00% 15.00% 2.2 Operating Margin - Cars Operating Margin - Engines Operating Margin - All Other Revenue 12.50% 13.00% 13.50% 14.00% 14.00% 14.00% 9.10% 10.00% 10.00% 10.00% 10.00% 10.00% 24.90% 25.00% 27.00% 28.00% 30.00% 30.00% Sensitivity analysis no 2.2 Net Working Capital Turnover Net Fixed Agget Turnover Deprec. & Amort./PPE 1.9 3.2 343 2 3.2 34% 2.1 3.3 34% 2.2 3.5 343 2.2 3.7 343 WACC Growth 343 Price Per Share 5% 47.381 2% WACC 72 12 24.31 23 26.86 3% 30.70 4% 37.03 5% 49.87 Financial Forecast Growth Car Shipments (0000) : Avg Revenue per Car (Euro 000) Car Revenue Engine Revenue All Other Revenue Total Revenue Revenue Growth 7.26 7.76 8.15 8.48 8.82 9.08 268 281 295 310 326 342 1,944 2,184 2,408 2,629 2,871 3,105 311 320 330 340 350 361 507 523 554 587 623 660 2,762 3,027 3,292 3,556 3,844 4,126 18.30% 9.60% 8.70% 8.00% 8.10% 7.30% % % % 8.00% 20.08 21.61 23.74 26.93 32.26 9% % 16.93 17.86 19.10 20.84 23.45 10% 14.45 15.07 15.80 16.79 18.17 Operating Profit Core Operating Profit - Engines Operating Profit - All Other Revenue Total Operating Profit Calculate Operating Margin 243 284 325 368 402 435 28 32 33 34 35 36 126 131 150 164 187 198 398 447 508 567 624 669 14.40% 14.80% 15.40% 15.90% 16.20% 16.20% Net Working Capital Net PP&E and Int. Asscto Deprec. & Amort. 1,425 851 289 1,513 1,568 932 998 317 339 1,617 1,747 1,875 1,016 1,039 1,086 345 353 369 Total Revenue Growth EBITDA Margin Source: Care Writer Ertimeter 18% 25% 10% 25% 9% 26% % % 8% 26% % 8% 25% 7% 25% Actual 2014 *********** Forecast ******* 2016 2017 2018 2019 ady State 2015 2762.00 398.00 1425.00 851.00 Revenue Earning Before Interest + Tax Net workign capital Property, Plant, + Equipment Delta NWC Delta NPPE NOPAT Free Cash Flow Present Value 3027.00 3292.00 3556.00 3844.00 4126.00 4208.00 447.00 508.00 567.00 624.00 669.00 631.00 1513.00 1568.00 1617.00 1747.00 1875.00 1913.00 932.00 998.00 1016.00 1039.00 1086.00 1107.00 88.00 54.00 49.00 131.00 128.00 38.00 81.00 66.00 19.00 23.00 47.00 22.00 277.00 315.00 351.00 387.00 415.00 391.00 107.00 195.00 284.00 233.00 240.00 332.00 102.00 177.00 245.00 192.00 8862.00 1.00 2.00 3.00 4.00 5.00 6.00 Enterprise Value Terminal Value Tax Rate Debt (long term) WACCI Equity Shares Outstanding Price Per Share 9578.00 11071.00 0.38 510.00 0.05 9068.00 189.00 47.98