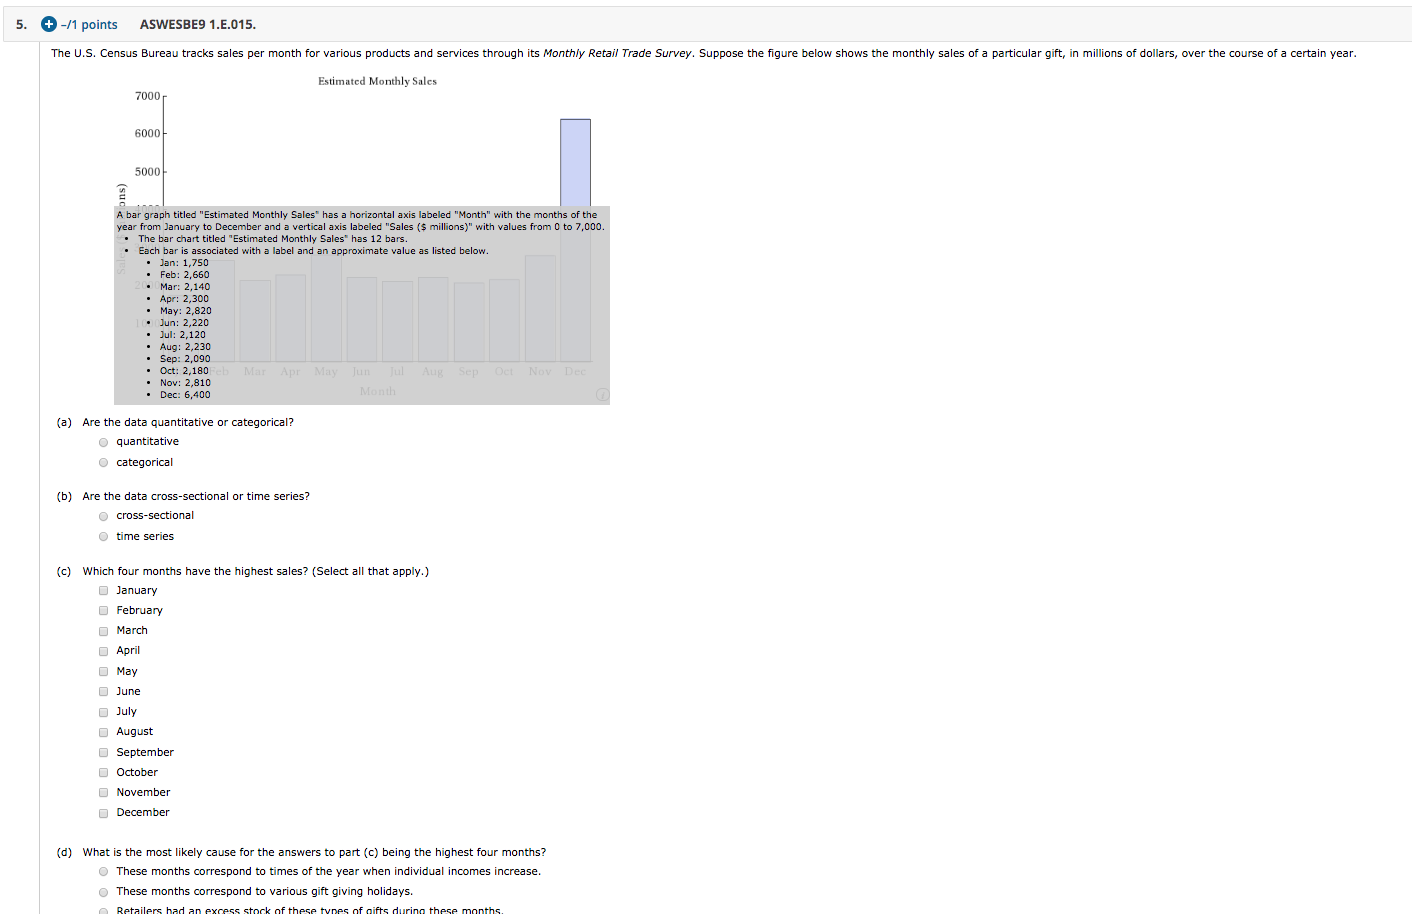
5. + -11 points ASWESBE9 1.E.015. The U.S. Census Bureau tracks sales per month for various products and services through its Monthly Retail Trade Survey. Suppose the figure below shows the monthly sales of a particular gift, in millions of dollars, over the course of a certain year. Estimated Monthly Sales 7000 6000 5000 A bar graph titled "Estimated Monthly Sales" has a horizontal axis labeled "Month" with the months of the year from January to December and a vertical axis labeled "Sales ($ millions)" with values from 0 to 7,000. The bar chart titled "Estimated Monthly Sales" has 12 bars. Each bar is associated with a label and an approximate value as listed below. . Jan: 1.750 Feb: 2,660 2. Mar: 2,140 Apr: 2,300 May: 2,820 Jun: 2,220 Jul: 2,120 Aug: 2,230 Sep: 2,090 Oct: 2,180b Mar Apr May Jun Jul Aug Sep Oct Nov Dec Nov: 2,810 Dec: 6,400 Month (a) Are the data quantitative or categorical? quantitative categorical (b) Are the data cross-sectional or time series? O cross-sectional time series (c) Which four months have the highest sales? (Select all that apply.) January February March April o May June July August September October November December (d) What is the most likely cause for the answers to part (c) being the highest four months? These months correspond to times of the year when individual incomes increase. These months correspond to various gift giving holidays. Retailers had an excess stock of these types of gifts during these months. 5. + -11 points ASWESBE9 1.E.015. The U.S. Census Bureau tracks sales per month for various products and services through its Monthly Retail Trade Survey. Suppose the figure below shows the monthly sales of a particular gift, in millions of dollars, over the course of a certain year. Estimated Monthly Sales 7000 6000 5000 A bar graph titled "Estimated Monthly Sales" has a horizontal axis labeled "Month" with the months of the year from January to December and a vertical axis labeled "Sales ($ millions)" with values from 0 to 7,000. The bar chart titled "Estimated Monthly Sales" has 12 bars. Each bar is associated with a label and an approximate value as listed below. . Jan: 1.750 Feb: 2,660 2. Mar: 2,140 Apr: 2,300 May: 2,820 Jun: 2,220 Jul: 2,120 Aug: 2,230 Sep: 2,090 Oct: 2,180b Mar Apr May Jun Jul Aug Sep Oct Nov Dec Nov: 2,810 Dec: 6,400 Month (a) Are the data quantitative or categorical? quantitative categorical (b) Are the data cross-sectional or time series? O cross-sectional time series (c) Which four months have the highest sales? (Select all that apply.) January February March April o May June July August September October November December (d) What is the most likely cause for the answers to part (c) being the highest four months? These months correspond to times of the year when individual incomes increase. These months correspond to various gift giving holidays. Retailers had an excess stock of these types of gifts during these months


