5. [-/2.81 Points] DETAILS DEVORESTAT9 7.2.012. MY NOTES ASK YOUR TEACHER PRACTICE ANOTHER The following observations are lifetimes (days) subsequent to diagnosis for individuals suffering
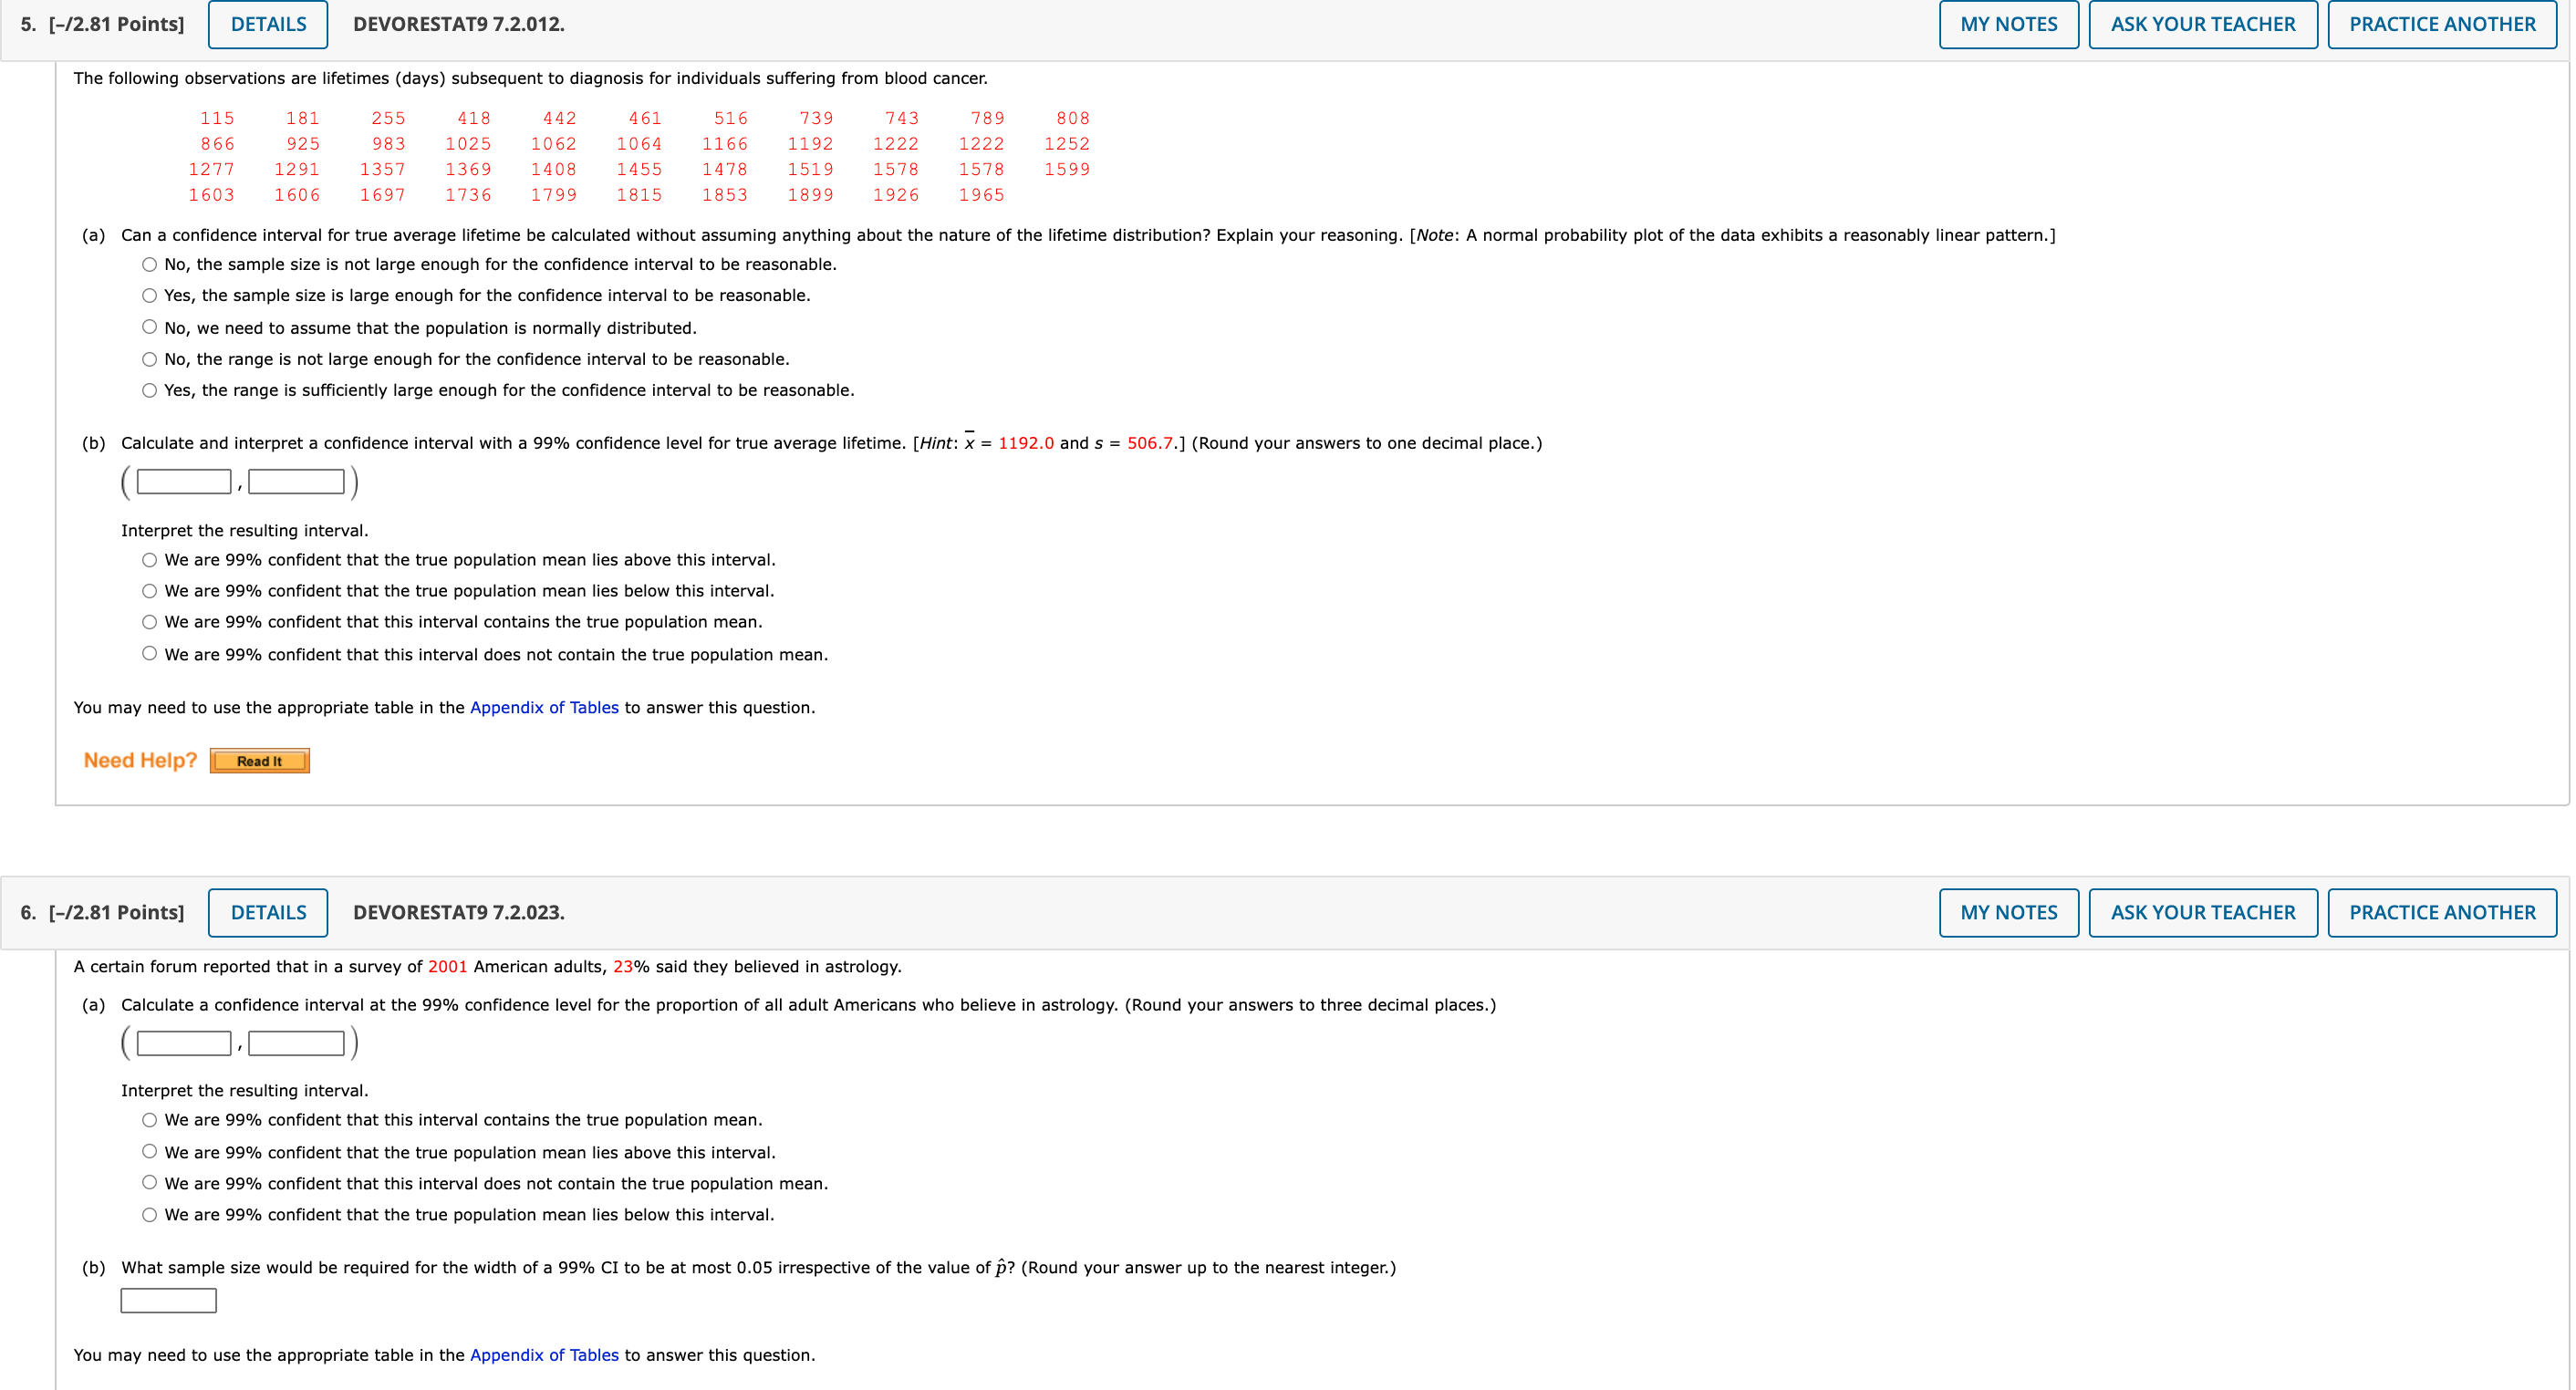
5. [-/2.81 Points] DETAILS DEVORESTAT9 7.2.012. MY NOTES ASK YOUR TEACHER PRACTICE ANOTHER The following observations are lifetimes (days) subsequent to diagnosis for individuals suffering from blood cancer. 115 181 255 418 442 461 516 739 743 789 808 866 925 983 1025 1062 1064 1166 1192 1222 1222 1252 1277 1291 1357 1369 1408 1455 1478 1519 157 1578 1599 1603 1606 1697 1736 1799 1815 1853 1899 1926 1965 (a) Can a confidence interval for true average lifetime be calculated without assuming anything about the nature of the lifetime distribution? Explain your reasoning. [Note: A normal probability plot of the data exhibits a reasonably linear pattern. ] O No, the sample size is not large enough for the confidence interval to be reasonable. O Yes, the sample size is large enough for the confidence interval to be reasonable O No, we need to assume that the population is normally distributed. O No, the range is not large enough for the confidence interval to be reasonable. O Yes, the range is sufficiently large enough for the confidence interval to be reasonable. (b) Calculate and interpret a confidence interval with a 99% confidence level for true average lifetime. [Hint: x = 1192.0 and s = 506.7.] (Round your answers to one decimal place.) Interpret the resulting interval. O We are 99% confident that the true population mean lies above this interval. O We are 99% confident that the true population mean lies below this interval. O We are 99% confident that this interval contains the true population mean. O We are 99% confident that this interval does not contain the true population mean. You may need to use the appropriate table in the Appendix of Tables to answer this question. Need Help? Read It 6. [-/2.81 Points] DETAILS DEVORESTAT9 7.2.023. MY NOTES ASK YOUR TEACHER PRACTICE ANOTHER A certain forum reported that in a survey of 2001 American adults, 23% said they believed in astrology. (a) Calculate a confidence interval at the 99% confidence level for the proportion of all adult Americans who believe in astrology. (Round your answers to three decimal places.) Interpret the resulting interval. O We are 99% confident that this interval contains the true population mean. O We are 99% confident that the true population mean lies above this interval. O We are 99% confident that this interval does not contain the true population mean. O We are 99% confident that the true population mean lies below this interval. (b) What sample size would be required for the width of a 99% CI to be at most 0.05 irrespective of the value of p? (Round your answer up to the nearest integer.) You may need to use the appropriate table in the Appendix of Tables to answer this
Step by Step Solution
There are 3 Steps involved in it
Step: 1
Get Instant Access to Expert-Tailored Solutions
See step-by-step solutions with expert insights and AI powered tools for academic success
Step: 2
Step: 3
Ace Your Homework with AI
Get the answers you need in no time with our AI-driven, step-by-step assistance