

Answered step by step
Verified Expert Solution
Question
1 Approved Answer
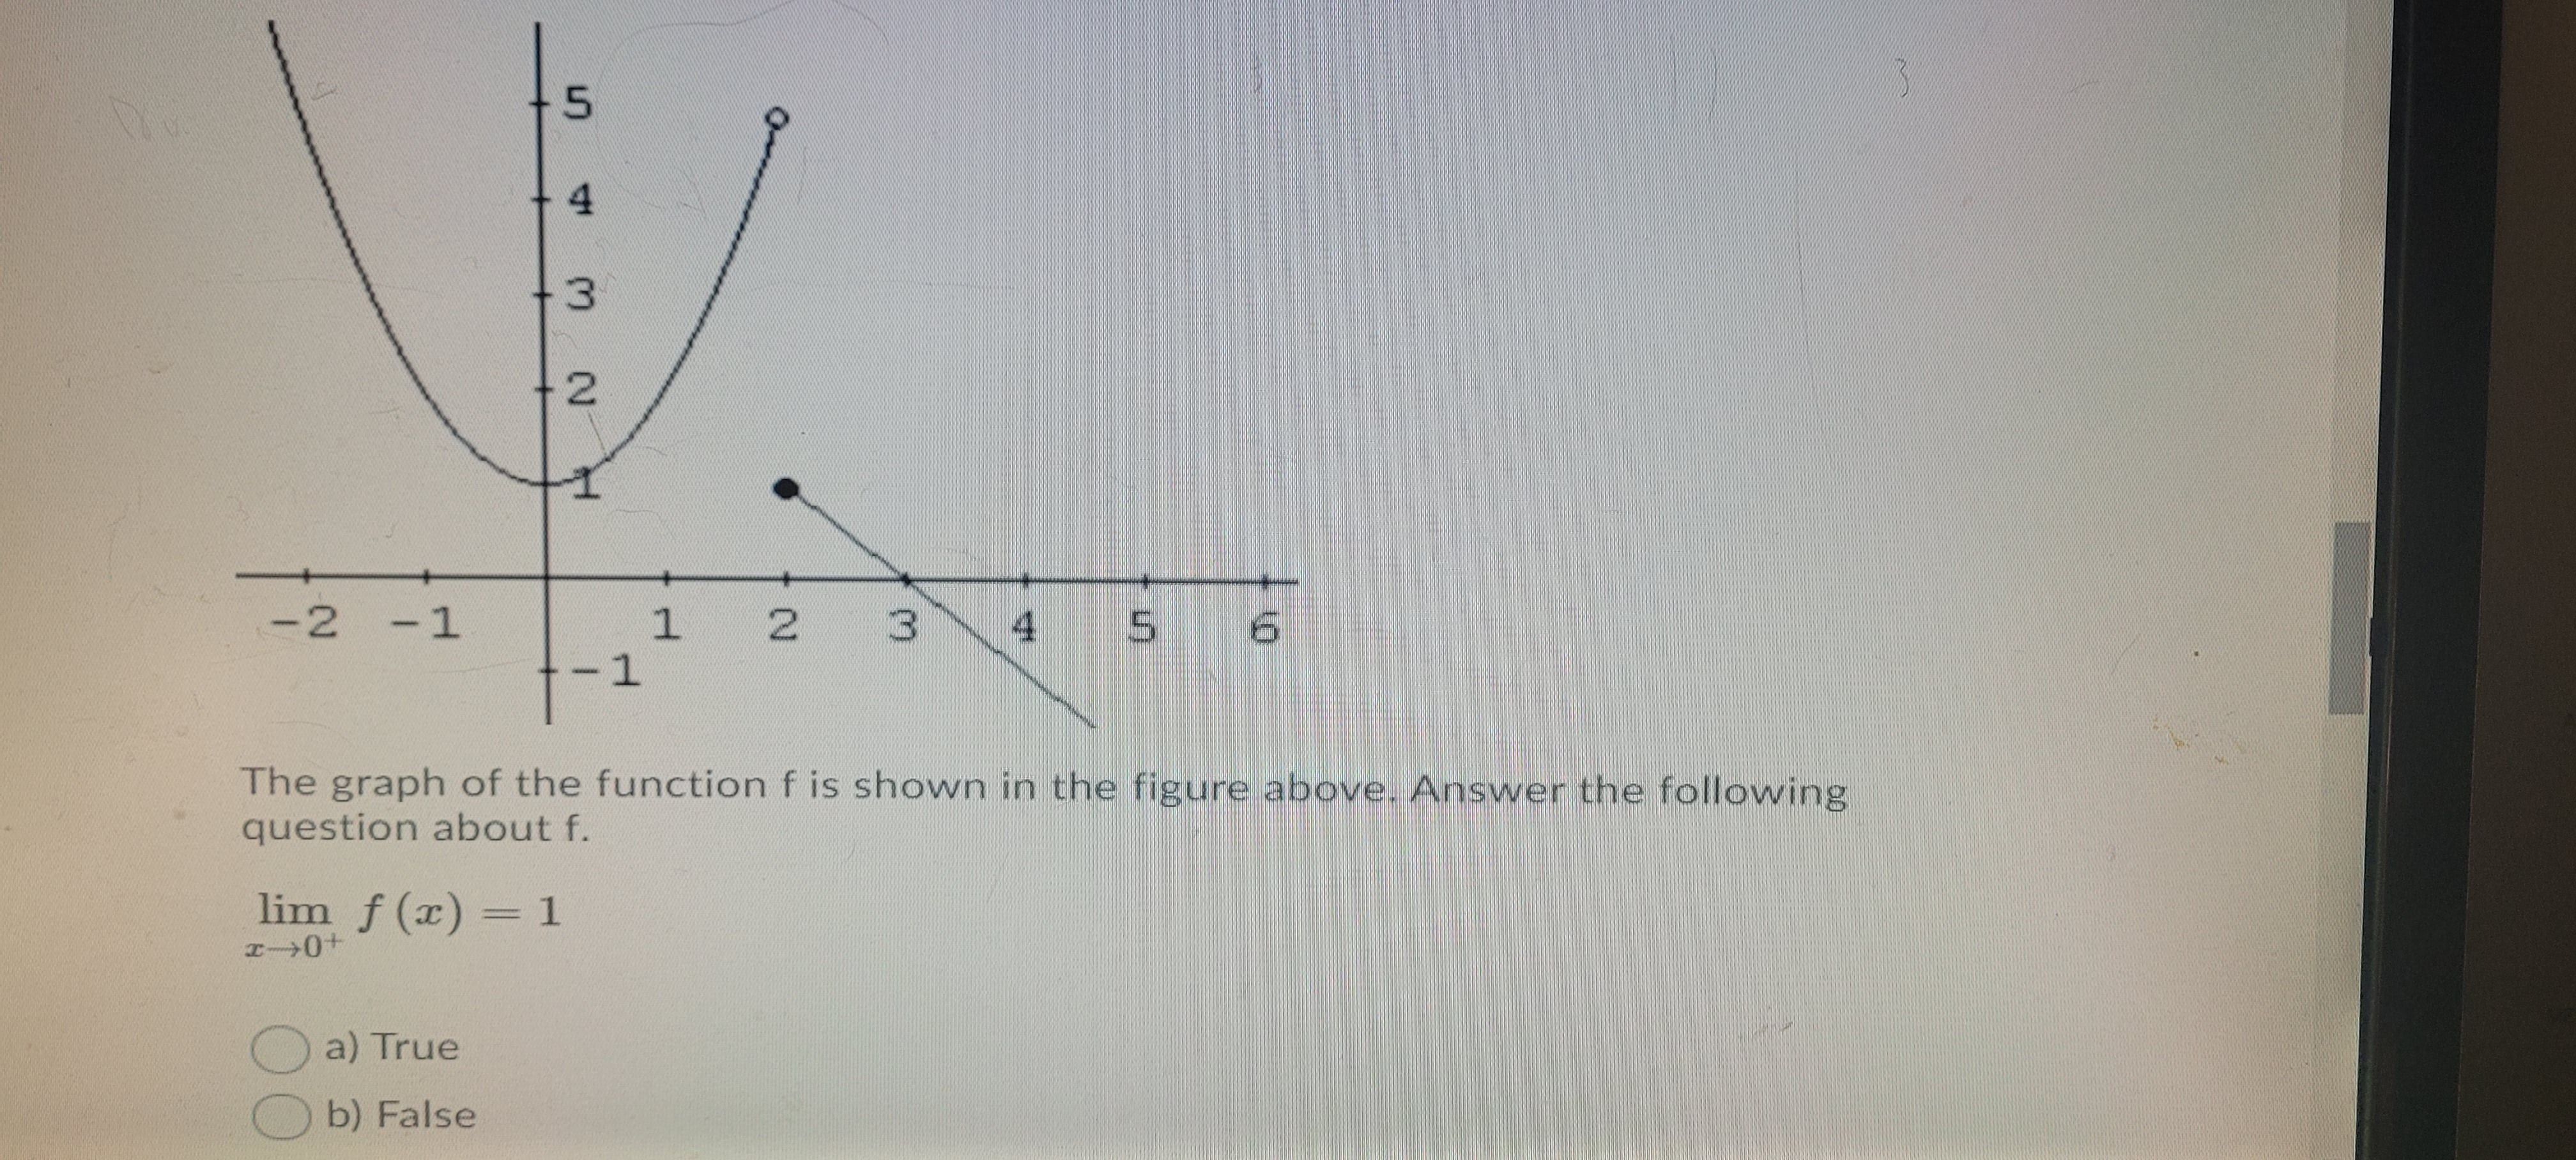
5 4 3 2 -2 - 1 1 2 3 5 6 - 1 The graph of the function f is shown in the figure
Step by Step Solution
There are 3 Steps involved in it
Step: 1

Get Instant Access to Expert-Tailored Solutions
See step-by-step solutions with expert insights and AI powered tools for academic success
Step: 2

Step: 3
Ace Your Homework with AI
Get the answers you need in no time with our AI-driven, step-by-step assistance
Get Started
A Graphical Approach To College Algebra
Authors: John E Hornsby, Gary K Rockswold, Margaret K Lial
5th Edition
0321908260, 9780321908261