Question
5. A bungee jumper jumps from a bridge that is 100 m above water level. A velocity-time graph is shown. The elasticity in the


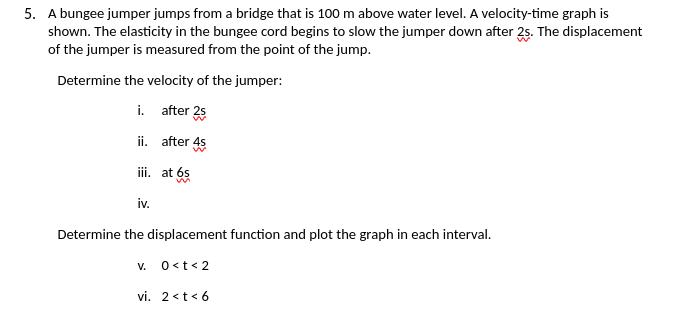
5. A bungee jumper jumps from a bridge that is 100 m above water level. A velocity-time graph is shown. The elasticity in the bungee cord begins to slow the jumper down after 2s. The displacement of the jumper is measured from the point of the jump. Determine the velocity of the jumper: i. after 25 ii. after 4s w iii. at 6s iv. m Determine the displacement function and plot the graph in each interval. V. 0 30 v(t) 20- 10- 10+ 2 t
Step by Step Solution
There are 3 Steps involved in it
Step: 1

Get Instant Access to Expert-Tailored Solutions
See step-by-step solutions with expert insights and AI powered tools for academic success
Step: 2

Step: 3

Ace Your Homework with AI
Get the answers you need in no time with our AI-driven, step-by-step assistance
Get StartedRecommended Textbook for
Physics
Authors: Alan Giambattista, Betty Richardson, Robert Richardson
2nd edition
77339681, 978-0077339685
Students also viewed these Physics questions
Question
Answered: 1 week ago
Question
Answered: 1 week ago
Question
Answered: 1 week ago
Question
Answered: 1 week ago
Question
Answered: 1 week ago
Question
Answered: 1 week ago
Question
Answered: 1 week ago
Question
Answered: 1 week ago
Question
Answered: 1 week ago
Question
Answered: 1 week ago
Question
Answered: 1 week ago
Question
Answered: 1 week ago
Question
Answered: 1 week ago
Question
Answered: 1 week ago
Question
Answered: 1 week ago
Question
Answered: 1 week ago
Question
Answered: 1 week ago
Question
Answered: 1 week ago
Question
Answered: 1 week ago
Question
Answered: 1 week ago
Question
Answered: 1 week ago
View Answer in SolutionInn App


