Answered step by step
Verified Expert Solution
Link Copied!

Question

1 Approved Answer

5. As you are no doubt aware, in its momentous decision in Roe v. Wade (1973), the US Supreme Court declared that state may not

5. As you are no doubt aware, in its momentous decision in Roe v. Wade (1973), the US Supreme Court declared that state may not outlaw abortion. Even so, many state legislatures have enacted restrictions and regulations that, while not banning abortion, make an abortion more difficult to obtain. Other states, however, have few or no restrictions. What factors might explain these differences in abortion laws among the states? We know that the public remains divided on this issue. Public opinion in some states is more favorable toward permitting abortion, whereas public opinion is less favorable in other states. Does public opinion guide state policy on this issue?

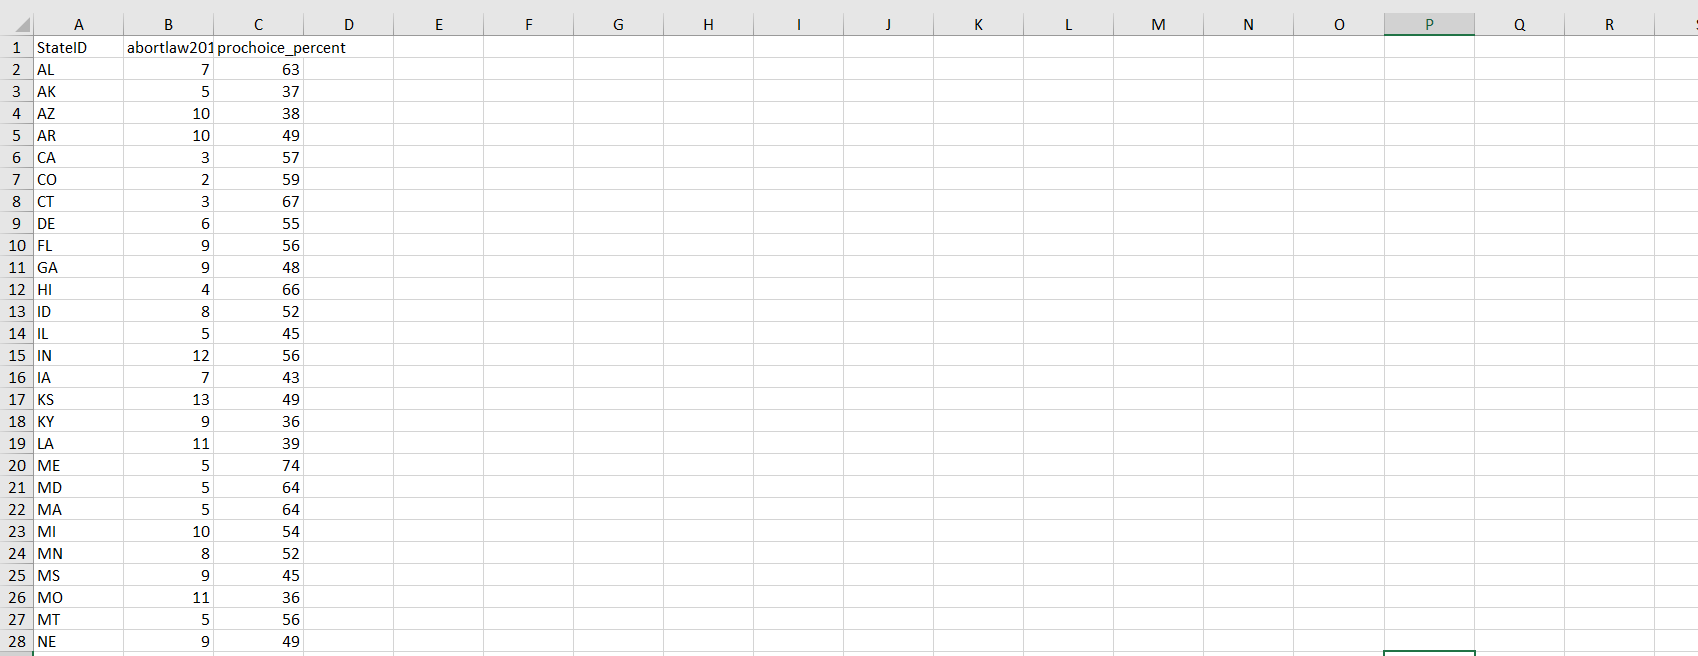
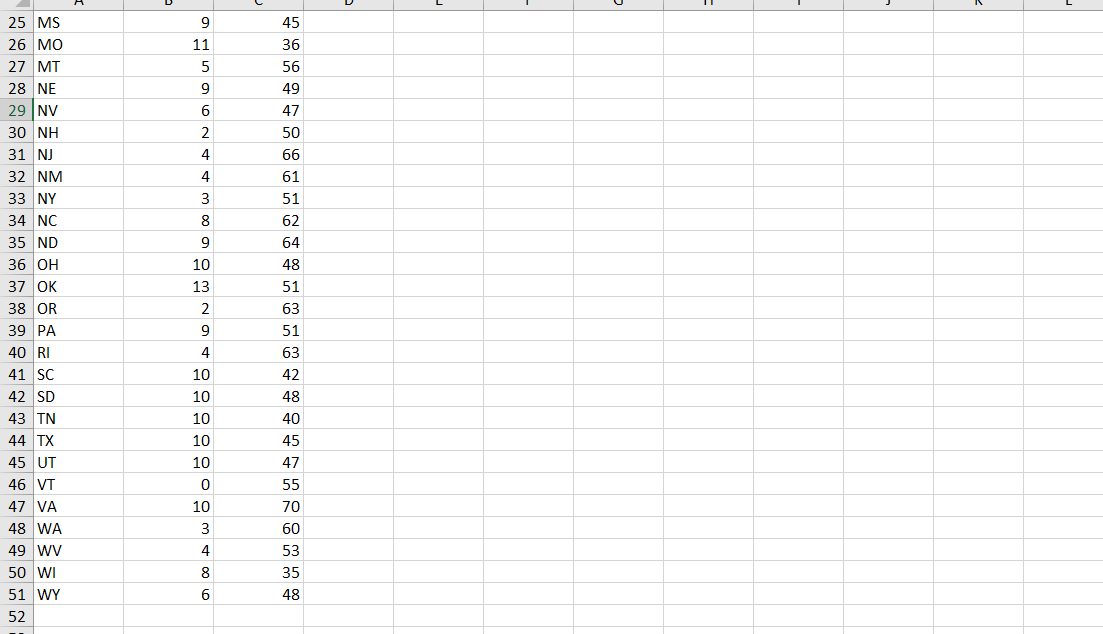
The excel data sheet labeled "States", contain data which measures the number of abortion restrictions a state has enacted into law. Values on abortlaw2017 range from 0 (least restrictive) to 13 (most restrictive). This is the DV. The dataset also has the variable prochoice_percent, the percentage of the mass public that is pro-choice (thus opposed to putting restriction on abortion access). This is the IV.

5.1. If you were to use regression analysis to test the idea that public opinion on abortion affects state abortion policy, you would expect to find:

a. a negative sign on prochoice_percent's regression coefficient b. a positive sign on prochoice_percent's regression coefficient

a. 0.18 b. 0.001 c. 4.65E-08 d. 15 e. 50 f. 0.04 g. -0.15 h. -3.45 I. 2.3 j. 0.2 k. 6.5

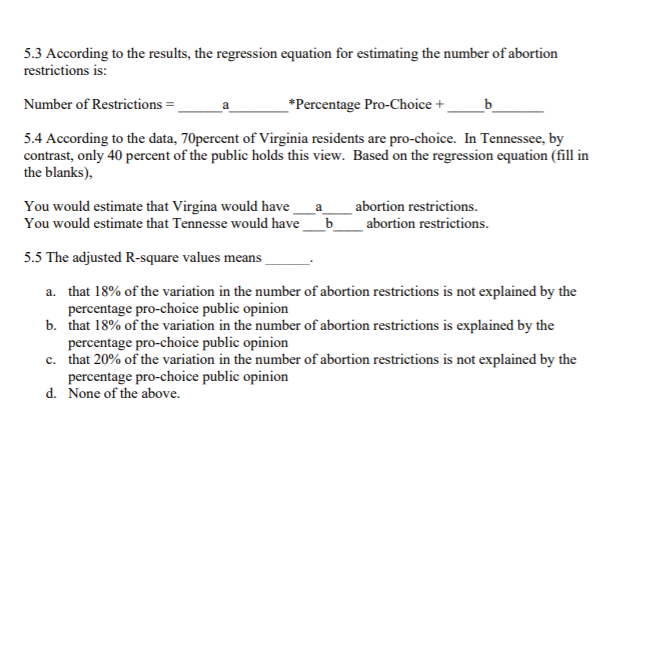
5.3 According to the results, the regression equation for estimating the number of abortion restrictions is:

Number of Restrictions = ______a________*Percentage Pro-Choice + _____b_______

5.4 According to the data, 70percent of Virginia residents are pro-choice. In Tennessee, by contrast, only 40 percent of the public holds this view. Based on the regression equation (fill in the blanks),

You would estimate that Virgina would have ___a____ abortion restrictions.

You would estimate that Tennesse would have ___b____ abortion restrictions.

5.5 The adjusted R-square values means ______.

a. that 18% of the variation in the number of abortion restrictions is not explained by the percentage pro-choice public opinion

b. that 18% of the variation in the number of abortion restrictions is explained by the percentage pro-choice public opinion

c. that 20% of the variation in the number of abortion restrictions is not explained by the percentage pro-choice public opinion

d. None of the above.
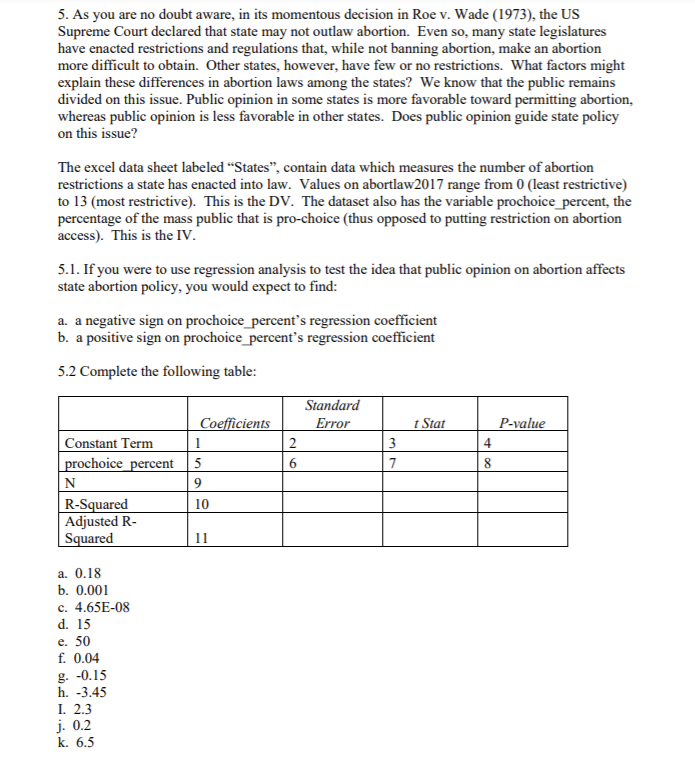
image text in transcribedimage text in transcribedimage text in transcribedimage text in transcribed
5. As you are no doubt aware, in its momentous decision in Roe v. Wade (1973), the US Supreme Court declared that state may not outlaw abortion. Even so, many state legislatures have enacted restrictions and regulations that, while not banning abortion, make an abortion more difficult to obtain. Other states, however, have few or no restrictions. What factors might explain these differences in abortion laws among the states? We know that the public remains divided on this issue. Public opinion in some states is more favorable toward permitting abortion, whereas public opinion is less favorable in other states. Does public opinion guide state policy on this issue? The excel data sheet labeled "States", contain data which measures the number of abortion restrictions a state has enacted into law. Values on abortlaw2017 range from 0 (least restrictive) to 13 (most restrictive). This is the DV. The dataset also has the variable prochoice_percent, the percentage of the mass public that is pro-choice (thus opposed to putting restriction on abortion access). This is the IV. 5.1. If you were to use regression analysis to test the idea that public opinion on abortion affects state abortion policy, you would expect to find: a. a negative sign on prochoice_percent's regression coefficient b. a positive sign on prochoice_percent's regression coefficient 5.2 Complete the following table: Standard Coefficients Error 1 Star P-value Constant Term 1 2 3 4 prochoice percent 5 6 7 8 N 9 R-Squared 10 Adjusted R- Squared 11 a. 0.18 b. 0.001 c. 4.65E-08 d. 15 e. 50 f. 0.04 g. -0.15 h. -3.45 I. 2.3 j. 0.2 k. 6.55.3 According to the results, the regression equation for estimating the number of abortion restrictions is: Number of Restrictions = #Percentage Pro-Choice + b 5.4 According to the data, 70percent of Virginia residents are pro-choice. In Tennessee, by contrast, only 40 percent of the public holds this view. Based on the regression equation (fill in the blanks), You would estimate that Virgina would have a abortion restrictions. You would estimate that Tennesse would have b abortion restrictions. 5.5 The adjusted R-square values means a. that 18% of the variation in the number of abortion restrictions is not explained by the percentage pro-choice public opinion b. that 18% of the variation in the number of abortion restrictions is explained by the percentage pro-choice public opinion c. that 20% of the variation in the number of abortion restrictions is not explained by the percentage pro-choice public opinion d. None of the above.A B C D E F G H K L M N P Q R 1 StateID abortlaw201 prochoice_percent 2 AL 7 63 3 AK 37 AZ 10 38 5 AR 10 49 CA 3 57 CO 2 59 8 3 67 9 DE 6 55 10 FL 56 11 GA 48 12 HI 66 13 ID 52 14 IL 45 15 IN 12 56 16 IA 43 17 KS 13 49 18 KY 9 36 19 LA 11 39 20 ME 74 21 MD UT UT UT 64 22 MA 64 23 MI 10 54 24 MN 52 25 MS 45 26 MO 11 36 27 MT 56 LD UT 28 NE 4925 MS 45 26 MO 11 36 27 MT 56 28 NE 9 49 29 NV 47 30 NH 50 31 NJ 66 32 NM 61 33 NY 51 34 NC 62 35 ND 64 36 OH 10 48 37 OK 13 51 38 OR 2 63 39 PA 9 51 40 RI 4 63 41 SC 10 42 42 SD 10 48 TN 10 40 44 TX 10 45 45 UT 10 47 46 0 55 47 VA 10 70 48 WA 3 60 49 WV 4 53 50 WI 8 35 51 WY 6 48 52

Step by Step Solution

There are 3 Steps involved in it

Step: 1

blur-text-image

Get Instant Access to Expert-Tailored Solutions

See step-by-step solutions with expert insights and AI powered tools for academic success

Step: 2

blur-text-image_2

Step: 3

blur-text-image_3

Ace Your Homework with AI

Get the answers you need in no time with our AI-driven, step-by-step assistance

Get Started

Recommended Textbook for

Practical Linear Algebra A Geometry Toolbox

Authors: Gerald Farin, Dianne Hansford

4th Edition

1003051219, 9781003051213

More Books

Students also viewed these Mathematics questions

Question

What is the CR cost of the required type L 2 lathes?

Answered: 1 week ago

Question

What is meant by 'Wealth Maximization ' ?

Answered: 1 week ago

Question

a. Describe the encounter. What made it intercultural?

Answered: 1 week ago