

Question
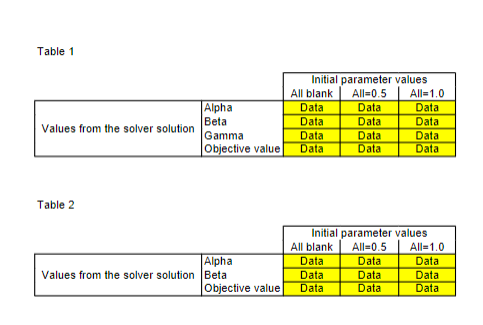
5. Based on your results in Table 1 what should be the best values for , and for the company to use in forecasting next
5. Based on your results in Table 1 what should be the "best" values for , and for the company to use in forecasting next year's demand? Give a justification for your answer.
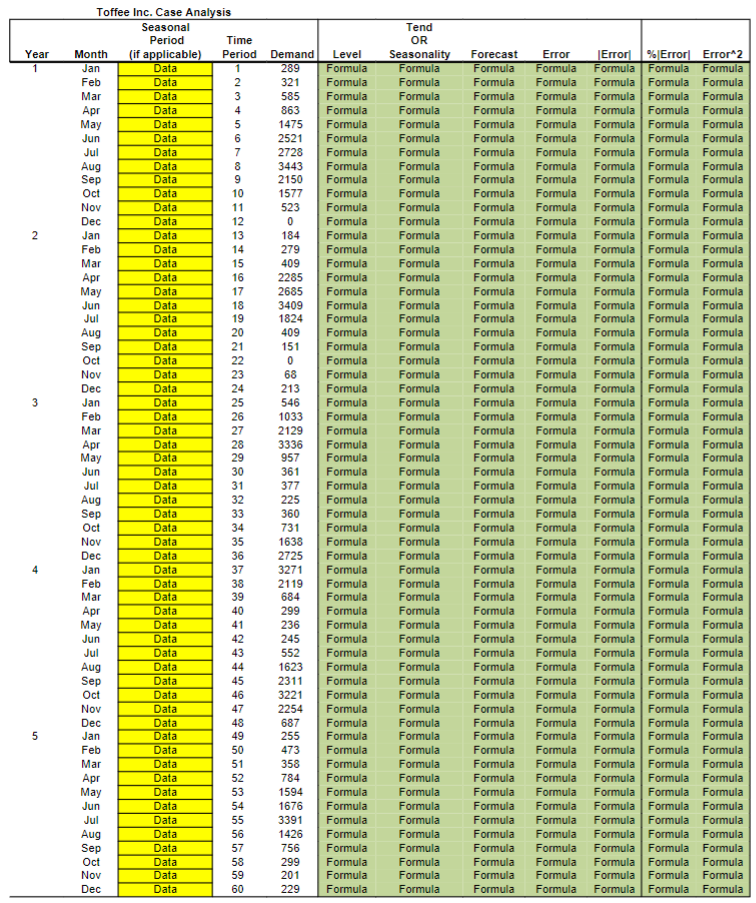
6. The plot in #1 suggests that a simpler exponential smoothing technique (e.g., double exponential smoothing OR exponential smoothing with seasonality only) may be adequate for the demand data.
a. Provide a justification for which simpler exponential smoothing technique could be used based on the plot in #1.
b. Open the second worksheet titled 'Simpler Forecasting Model' and complete the formulas in Columns F to J in that Excel worksheet based on your answer to #6a. You can use parameter values of =0.5 and =0.5 in cells T4 and T5, respectively, as initial values for these parameters. Complete the formula for MAD, MAPE or MSE in cell T8, based on your chosen criterion in #2. Re-do the analysis in #4 for the simpler model and put your results in Table 2 of the 'Forecast Analysis Tables' worksheet.
c. Based on your results in Table 2, what should be the "best" values for and for the simpler exponential smoothing model?
7. Is triple exponential smoothing an appropriate technique to use in forecasting the data? or should the simpler model be used instead to forecast next year's demand? Give a justification for your answer involving the comparison of your answers to #5 and #6c. 8. Based on your answer to #7, create the following in columns N to S in the worksheet titled 'Initial Forecasting Model' OR columns M to R in the worksheet titled 'Simpler Forecasting Model':
The first column (i.e., N in 'Initial Forecasting Model' or M in 'Simpler Forecasting Model') should contain the RSFE, at each period, over the relevant number of periods for the dataset. The next column (i.e., O in 'Initial Forecasting Model' or N in 'Simpler Forecasting Model') should contain the MAD, at each period, over the relevant number of periods for the dataset. The next column (i.e., P in 'Initial Forecasting Model' or O in 'Simpler Forecasting Model') should contain the TS (i.e., tracking signal), at each period, over the relevant number of periods for the dataset. The next column (i.e., Q in 'Initial Forecasting Model' or P in 'Simpler Forecasting Model') should be a column of 4's (i.e., the number 4 repeated for each period) over the relevant number of periods for the dataset. This represents the Upper Limit (i.e., UL) for the tracking signals. The next column (i.e., R in 'Initial Forecasting Model' or Q in 'Simpler Forecasting Model') should be a column of 0's (i.e., the number 0 repeated for each period) over the relevant number of periods for the dataset. This represents the Center Line (i.e., CL) for the tracking signals. The final column (i.e., S in 'Initial Forecasting Models' or R in 'Simpler Forecasting Model') should be a column of -4's (i.e., the number -4 repeated for each period) over the relevant number of periods for the dataset. This represents the Lower Limit (i.e., LL) for the tracking signals.
Plot the TS, UL, CL and LL (i.e., columns P to S in 'Initial Forecasting Model' OR columns O to R in 'Simpler Forecasting Model') in Excel using the line plot option. Format the UL, CL and LL lines to be the same thickness and color. Delete the legend associated with the plot and provide an appropriate title and labels for the axes of the graph. Include a copy of the graph in your PDF document. What does the graph suggest about the forecasts based on your "best" forecasting model from #7?
9. Based on insights from your answers to questions #7 and #8 what should be the "best" values of the parameters (i.e., , and in the 'Initial Forecasting Model' worksheet OR and in the 'Simpler Forecasting Model' )? Provide justifications (e.g., plots/tables and exp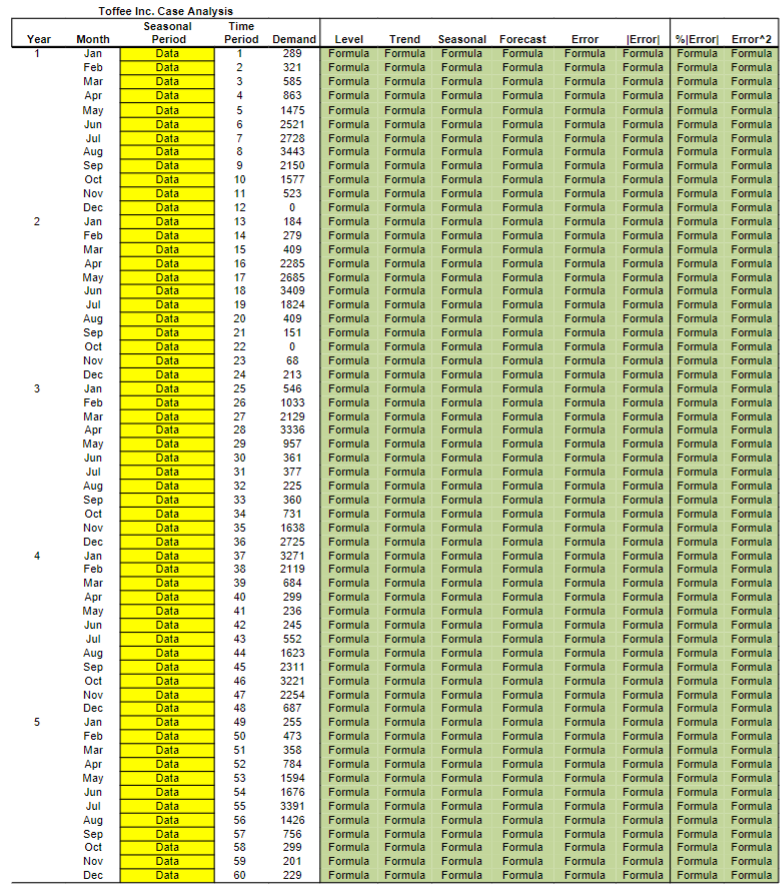
Step by Step Solution
There are 3 Steps involved in it
Step: 1

Get Instant Access to Expert-Tailored Solutions
See step-by-step solutions with expert insights and AI powered tools for academic success
Step: 2

Step: 3
Ace Your Homework with AI
Get the answers you need in no time with our AI-driven, step-by-step assistance
Get Started
Audit Function Strategy Driving Audit Value The Best Practice Strategy Guide For Maximising The Audit Added Value At The Internal Audit Function Level Volume 1
Authors: Hans Beumer
1st Edition
3906861139, 978-3906861135