

Answered step by step
Verified Expert Solution
Question
1 Approved Answer
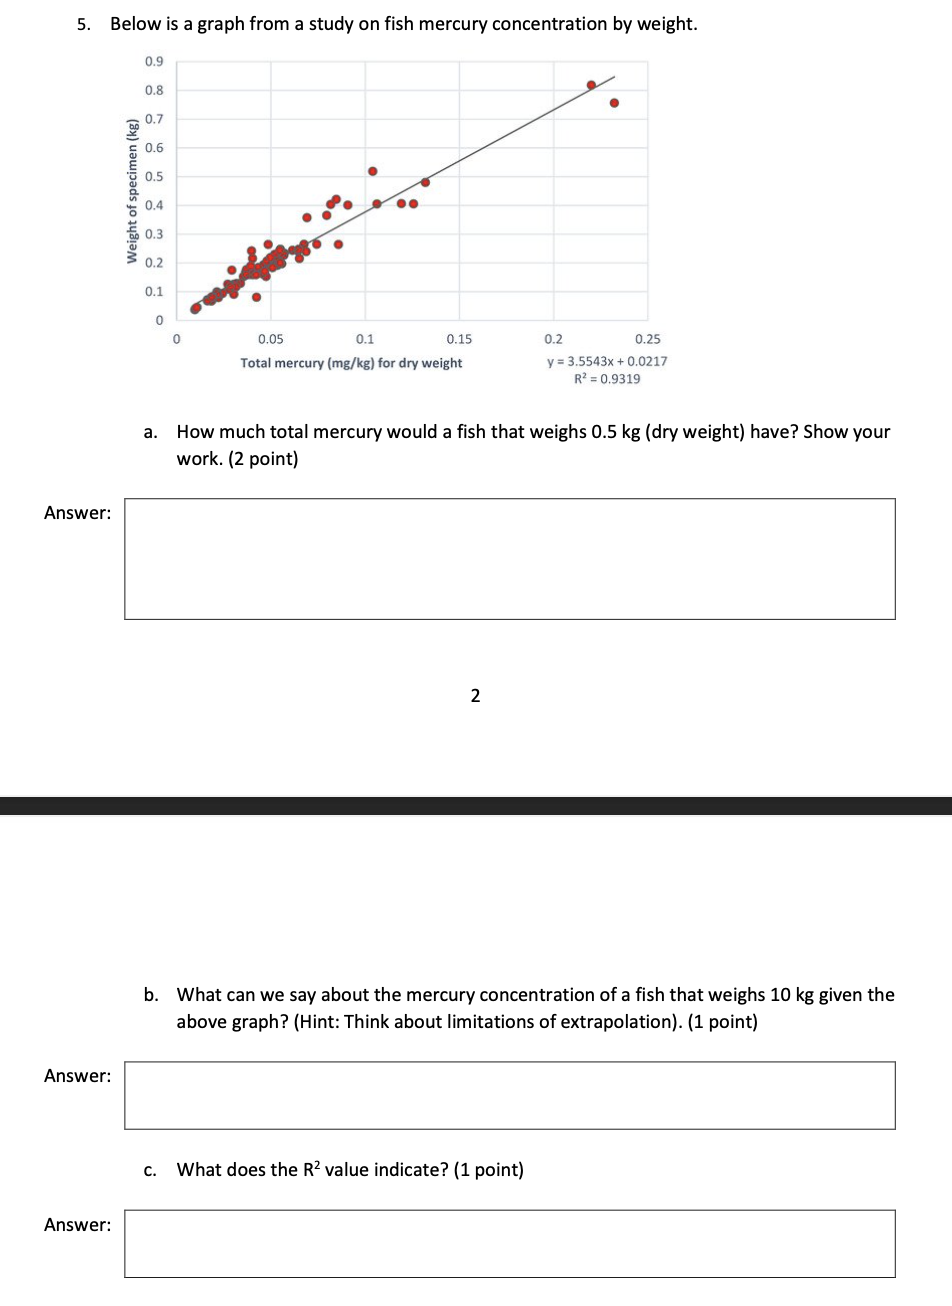
5. Below is a graph from a study on fish mercury concentration by weight. 0.9 0.8 0.7 0.6 0 .5 Weight of specimen (kg 0.4
Step by Step Solution
There are 3 Steps involved in it
Step: 1

Get Instant Access to Expert-Tailored Solutions
See step-by-step solutions with expert insights and AI powered tools for academic success
Step: 2

Step: 3
Ace Your Homework with AI
Get the answers you need in no time with our AI-driven, step-by-step assistance
Get Started
WebAssign For Differential Equations With Boundary-Value Problems
Authors: Dennis G Zill
9th Edition
1337879762, 9781337879767