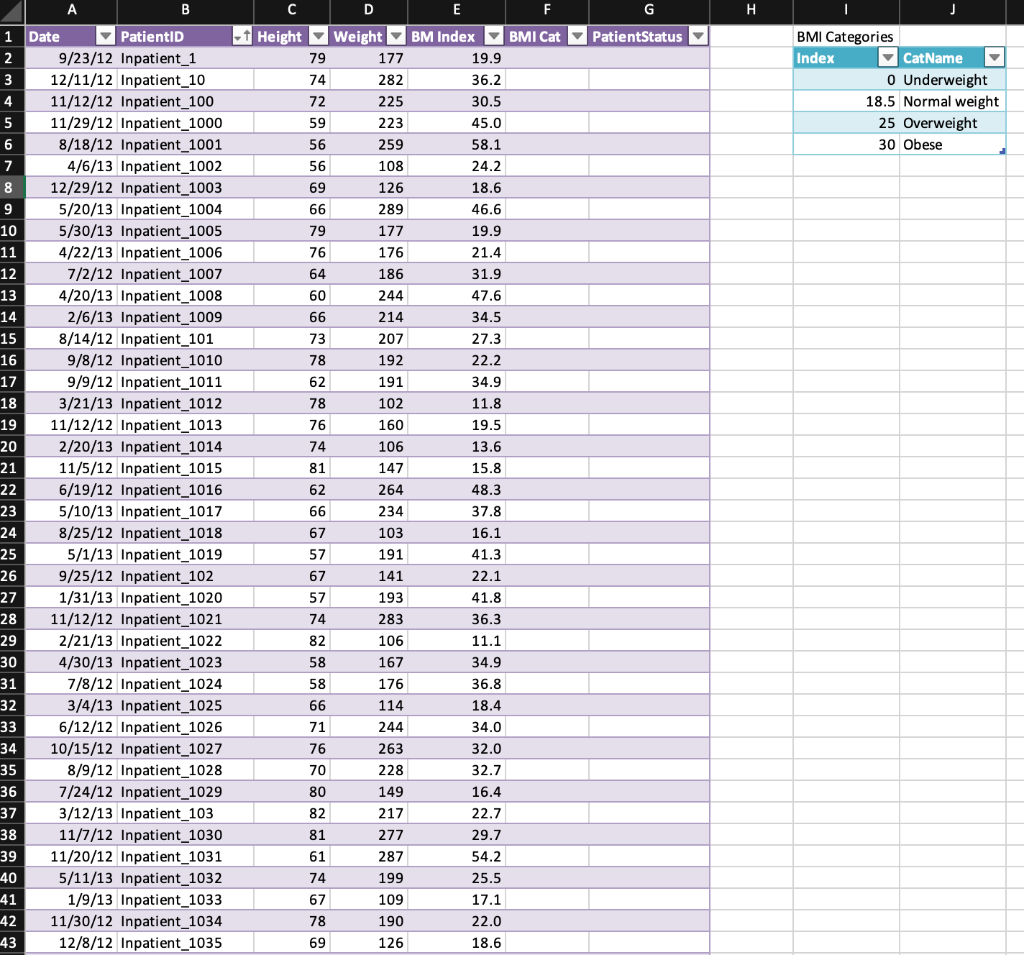

5. Calculate BMI Category in a new column using INDEX-MATCH and the BMI category designations given. Create a lookup Excel table to provide BMI category names Underweight, Normal Weight, Overweight, and Obese. 6. Assign Patient Status in new column based on PatientID column (IF statement is one possible solution) 7. Using data validation, structured table references, and index-match, obtain a correct measurement (height, weight, or BMI) for any patient chosen from a list. Data validation will not accept a structured table reference directly, but you can put a structured table reference in data validation by using the indirect function with a text string that looks like a structured table reference. Use Indirect and text strings that look like structured table references for both the row match and column match. See PatientData!18:19 in solution file. 8. Use COUNTIF to calculate the BMI categories in the BMI Cat column of tblPatients. Count all four BMI categories. See PatientData!I12:J15. 9. Create a small column chart for BMI categories and make it look like the one in the solution file shown in the PatientData worksheet. 10. Show summary statistics, height histogram and BMI histogram like the solution StatOverview worksheet. If you are working with a personal copy of Excel you might have to add-in the Analysis Tool Pack (File > Options > Add-ins. Use the bin range shown in the solution worksheet. 11. Show histogram for random heights actual data from de-identified health care charts. Also show summary stats. 12. Create a pivot table and pivot chart for average weight by year and quarter as shown in the Pivot-height worksheet. Group date in rows before moving date to the report filter. H BMI Categories Index CatName O Underweight 18.5 Normal weight 25 Overweight 30 Obese 22.2 A B F 1 Date PatientID - Height Weight BM Index BMI Cat Patient Status 2 9/23/12 Inpatient_1 79 177 19.9 3 12/11/12 Inpatient_10 74 282 36.2 4 11/12/12 Inpatient_100 72 225 30.5 5 11/29/12 Inpatient_1000 59 223 45.0 6 8/18/12 Inpatient_1001 56 259 58.1 7 4/6/13 Inpatient_1002 56 108 24.2 8 12/29/12 Inpatient_1003 69 126 18.6 9 5/20/13 Inpatient_1004 66 289 46.6 10 5/30/13 Inpatient_1005 79 177 19.9 11 4/22/13 Inpatient_1006 76 176 21.4 12 7/2/12 Inpatient_1007 64 186 31.9 13 4/20/13 Inpatient_1008 60 244 47.6 14 2/6/13 Inpatient_1009 66 214 34.5 15 8/14/12 Inpatient_101 73 207 27.3 16 9/8/12 Inpatient_1010 78 192 17 9/9/12 Inpatient_1011 62 191 34.9 18 3/21/13 Inpatient_1012 78 102 11.8 19 11/12/12 Inpatient_1013 76 160 19.5 20 2/20/13 Inpatient_1014 74 106 13.6 21 11/5/12 Inpatient_1015 81 147 15.8 22 6/19/12 Inpatient_1016 62 264 48.3 23 5/10/13 Inpatient_1017 66 234 37.8 24 8/25/12 Inpatient_1018 67 103 16.1 25 5/1/13 Inpatient_1019 57 191 41.3 26 9/25/12 Inpatient_102 67 141 22.1 27 1/31/13 Inpatient_1020 57 193 41.8 28 11/12/12 Inpatient_1021 74 283 36.3 29 2/21/13 Inpatient_1022 82 106 11.1 30 4/30/13 Inpatient_1023 58 167 34.9 31 7/8/12 Inpatient_1024 58 176 36.8 32 3/4/13 Inpatient_1025 66 114 18.4 33 6/12/12 Inpatient_1026 71 244 34.0 34 10/15/12 Inpatient_1027 76 263 32.0 35 8/9/12 Inpatient_1028 70 228 32.7 36 7/24/12 Inpatient_1029 80 149 16.4 37 3/12/13 Inpatient_103 82 217 22.7 38 11/7/12 Inpatient_1030 81 277 29.7 39 11/20/12 Inpatient_1031 61 287 54.2 40 5/11/13 Inpatient_1032 74 199 25.5 41 1/9/13 Inpatient_1033 67 109 17.1 -42 11/30/12 Inpatient_1034 78 190 22.0 43 12/8/12 Inpatient_1035 69 126 18.6 5. Calculate BMI Category in a new column using INDEX-MATCH and the BMI category designations given. Create a lookup Excel table to provide BMI category names Underweight, Normal Weight, Overweight, and Obese. 6. Assign Patient Status in new column based on PatientID column (IF statement is one possible solution) 7. Using data validation, structured table references, and index-match, obtain a correct measurement (height, weight, or BMI) for any patient chosen from a list. Data validation will not accept a structured table reference directly, but you can put a structured table reference in data validation by using the indirect function with a text string that looks like a structured table reference. Use Indirect and text strings that look like structured table references for both the row match and column match. See PatientData!18:19 in solution file. 8. Use COUNTIF to calculate the BMI categories in the BMI Cat column of tblPatients. Count all four BMI categories. See PatientData!I12:J15. 9. Create a small column chart for BMI categories and make it look like the one in the solution file shown in the PatientData worksheet. 10. Show summary statistics, height histogram and BMI histogram like the solution StatOverview worksheet. If you are working with a personal copy of Excel you might have to add-in the Analysis Tool Pack (File > Options > Add-ins. Use the bin range shown in the solution worksheet. 11. Show histogram for random heights actual data from de-identified health care charts. Also show summary stats. 12. Create a pivot table and pivot chart for average weight by year and quarter as shown in the Pivot-height worksheet. Group date in rows before moving date to the report filter. H BMI Categories Index CatName O Underweight 18.5 Normal weight 25 Overweight 30 Obese 22.2 A B F 1 Date PatientID - Height Weight BM Index BMI Cat Patient Status 2 9/23/12 Inpatient_1 79 177 19.9 3 12/11/12 Inpatient_10 74 282 36.2 4 11/12/12 Inpatient_100 72 225 30.5 5 11/29/12 Inpatient_1000 59 223 45.0 6 8/18/12 Inpatient_1001 56 259 58.1 7 4/6/13 Inpatient_1002 56 108 24.2 8 12/29/12 Inpatient_1003 69 126 18.6 9 5/20/13 Inpatient_1004 66 289 46.6 10 5/30/13 Inpatient_1005 79 177 19.9 11 4/22/13 Inpatient_1006 76 176 21.4 12 7/2/12 Inpatient_1007 64 186 31.9 13 4/20/13 Inpatient_1008 60 244 47.6 14 2/6/13 Inpatient_1009 66 214 34.5 15 8/14/12 Inpatient_101 73 207 27.3 16 9/8/12 Inpatient_1010 78 192 17 9/9/12 Inpatient_1011 62 191 34.9 18 3/21/13 Inpatient_1012 78 102 11.8 19 11/12/12 Inpatient_1013 76 160 19.5 20 2/20/13 Inpatient_1014 74 106 13.6 21 11/5/12 Inpatient_1015 81 147 15.8 22 6/19/12 Inpatient_1016 62 264 48.3 23 5/10/13 Inpatient_1017 66 234 37.8 24 8/25/12 Inpatient_1018 67 103 16.1 25 5/1/13 Inpatient_1019 57 191 41.3 26 9/25/12 Inpatient_102 67 141 22.1 27 1/31/13 Inpatient_1020 57 193 41.8 28 11/12/12 Inpatient_1021 74 283 36.3 29 2/21/13 Inpatient_1022 82 106 11.1 30 4/30/13 Inpatient_1023 58 167 34.9 31 7/8/12 Inpatient_1024 58 176 36.8 32 3/4/13 Inpatient_1025 66 114 18.4 33 6/12/12 Inpatient_1026 71 244 34.0 34 10/15/12 Inpatient_1027 76 263 32.0 35 8/9/12 Inpatient_1028 70 228 32.7 36 7/24/12 Inpatient_1029 80 149 16.4 37 3/12/13 Inpatient_103 82 217 22.7 38 11/7/12 Inpatient_1030 81 277 29.7 39 11/20/12 Inpatient_1031 61 287 54.2 40 5/11/13 Inpatient_1032 74 199 25.5 41 1/9/13 Inpatient_1033 67 109 17.1 -42 11/30/12 Inpatient_1034 78 190 22.0 43 12/8/12 Inpatient_1035 69 126 18.6


